
Abstract
OBJECTIVE
Chest tube drainage restores negative intrathoracic pressure, which might alter cardiac loading. Digital thoracic drainage systems continuously record pressure and airflow. We examined device-derived pressure and air-flow trends over 48 hours and echocardiographic changes between 24 and 48 hours.
MATERIAL AND METHODS
Forty-one chest tube drainage episodes in 39 adult, non-mechanically ventilated patients were studied prospectively. Device records were analysed at 10-minute intervals, providing preset suction level, measured circuit pressure, and air flow. Echocardiography was performed at 24 and 48 hours. Continuous time-series analyses included 29 episodes, 28 of which were evaluable within the predefined 48-hour window. False discovery rate correction was applied to multiple comparisons.
RESULTS
The preset suction level remained unchanged during the first 48 hours in 21 of 29 episodes (72%), and the measured circuit pressure was closely related to it at each time point (R2 = 0.838-0.955). Air leak decreased from a median of 61.6 mL/min at baseline to 2.3 mL/min at 24 hours (P < 0.001), with no further change at 48 hours (1.3 mL/min; P = 0.55). After correction, ejection fraction (q = 0.011) and mitral E velocity (q = 0.007) were higher at 48 hours. No device-derived variable was associated with echocardiographic changes after correction for multiple comparisons.
CONCLUSION
Measured circuit pressure appeared to reflect regulated drainage-system pressure more closely than pleural physiology. Most reduction in air leak occurred before the first echocardiographic assessment, potentially limiting the detection of cardiopulmonary associations. These findings support a cautious interpretation of digital drainage parameters and may help define the assessment window for future studies.
Keywords: Chest tubes, thoracostomy, echocardiography, hemodynamics, heart function tests
Main Points
• The pressure recorded by a digital thoracic drainage system was closely related to the suction level preset by the treating physician and changed little over 24-48 hours when that level was left unchanged.
• The air leak, which the system measures but does not regulate, decreased markedly during the first 24 hours after chest tube placement and changed little between 24 and 48 hours.
• Echocardiographic changes between 24 and 48 hours were small and, after correction for multiple comparisons, were limited to ejection fraction and mitral E velocity.
• No device-derived variable was associated with echocardiographic change after correction for multiple comparisons.
• Most of the observed reduction in air leak occurred before the first echocardiogram. This finding may help define the optimal timing of cardiopulmonary assessment during pleural drainage.
INTRODUCTION
Chest tube placement is frequently required following pneumothorax, hemothorax, empyema, pleural effusion, and thoracic surgery. Under these conditions, the physiological negative intrathoracic pressure balance is disrupted, and closed underwater drainage systems are traditionally used to restore this equilibrium., They evacuate accumulated air and fluid from the intrapleural space, allowing re-establishment of negative pressure and lung re-expansion.
Conventional closed underwater drainage systems remain the most commonly used methods and rely primarily on gravity but provide no quantitative data on intrathoracic pressure or flow. Systems providing active negative pressure support were introduced to accelerate recovery,- yet these analog devices operate continuously and do not allow objective recording. Digital thoracic drainage systems (DTDS) enable continuous monitoring and recording of pressure and airflow, providing objective, comparable data. Systematic reviews and network meta-analyses of pulmonary resection have reported reductions in chest tube duration and hospital stay. Although comparative studies have not shown significant differences in overall clinical outcomes, digital systems offer objective quantitative assessment of air leaks and flow dynamics, and their air-flow patterns and pressure measurements derived from digital drainage systems have been suggested as predictors of postoperative course.
Disruption of the balance of negative intrathoracic pressure also directly affects cardiac function. Increased intrathoracic pressure reduces venous return and cardiac output, whereas a reduction in intrathoracic pressure during inspiration enhances venous return and influences stroke volume and overall cardiac performance. Where intrapleural pressure is elevated, compressive effects on the heart and pulmonary venous system may occur, and these effects have been demonstrated echocardiographically.
In the present study, pressure and air flow were recorded continuously by a DTDS in patients undergoing chest tube placement, and serial transthoracic echocardiography was performed over the same period. The aim was to characterize the temporal behaviour of pressure and air-flow measurements derived from the digital drainage system during the first 48 hours after chest tube placement, and to examine whether changes in these device-derived variables were associated with short-term changes in echocardiographic indices. We examined the time course of the device-derived pressure and air-flow variables over the first 48 hours; whether short-term changes in echocardiographic indices of cardiac filling and function were related to them; and whether the observed changes differed by chest tube laterality or by underlying disease. The clinical premise was that device-derived pressure and air-flow trends might provide complementary physiological context beyond conventional air-leak monitoring, rather than serve as direct surrogate measures of cardiac function.
MATERIAL AND METHODS
Study Design and Participants
This study was approved by the Necmettin Erbakan University Faculty of Medicine Clinical Research Ethics Committee (approval no.: 2014/65; date: March 26, 2014) and conducted in accordance with the Declaration of Helsinki. Written informed consent was obtained from all participants. Adult patients requiring chest tube drainage for any clinical indication, including tube thoracostomy alone and thoracic surgery, were eligible, provided that DTDS monitoring was intended to be maintained for at least 48 hours and written informed consent was obtained. Patients younger than 18 years, those who declined participation, those who required mechanical ventilation, those who had the DTDS removed before 48 hours, those who died before study completion, or those who could not consent because of impaired consciousness were excluded.
Two patients each underwent chest tube drainage on two separate occasions; thus, the study comprised 41 drainage episodes in 39 individual patients.
Clinical Data Collection and Digital Drainage Measurements
Baseline demographic and clinical data were recorded for all participants, including age, sex, height, body weight, indication for chest tube placement, laterality, type of surgical procedure, history of concomitant cardiac disease, and smoking exposure in pack-years.
Following chest tube insertion, a DTDS (Thopaz, Medela AG, Baar, Switzerland) was connected to the chest drain. The system continuously monitors the preset suction level, measured circuit pressure, and airflow, with values stored at 10-minute intervals. For the predefined study time points, device variables were summarized at 0, 24, and 48 hours using the recordings within ±45 minutes of each time point. The continuous time-series data were additionally used for exploratory analyses of within-episode temporal trends. The manufacturer’s default setting of -2.0 kPa was used unless a different level was clinically indicated.
The stored device files were used directly for analysis. DTDS monitoring was maintained for at least 48 hours in all included episodes, and scheduled device measurements were available at 0, 24, and 48 hours. For analyses requiring a continuous 10-minute device recording across the predefined 48-hour study interval, high-resolution time-series data spanning that interval were available for 29 of the 41 episodes; 28 of these provided evaluable measurements within the predefined 48-hour window. These analyses were therefore restricted according to the availability of continuous time-series data. The distinction, therefore, reflects the availability of continuous high-resolution data for the additional time-series analyses and does not indicate incomplete 48-hour clinical monitoring or absence of the scheduled 0-, 24-, and 48-hour device measurements. Pressures are reported in mmHg as magnitudes of negative pressure (the system records in kPa; -2.0 kPa corresponds to 15.0 mmHg and 20.4 cmH2O), so that larger values denote greater negative pressure. Air flow is reported in mL/min, the unit in which the system records it. Because the recorded air-flow signal reflects air passing through the drainage system, it is referred to as an air leak in the Results and Discussion, for clinical clarity.
Derived Variables
Because the pressure within the drainage circuit is maintained by the system at the preset level, two further variables were examined alongside it: air flow, which the system measures but does not regulate, and the deviation from the preset level, calculated for each recording as the difference between the measured circuit pressure and that level; this deviation reflects the extent to which circuit pressure departed from the level the system was set to maintain.
Echocardiographic Assessment
The 24- and 48-hour echocardiographic assessments were specified prospectively in the study protocol. Earlier imaging was considered but not adopted because intrapleural air and fluid reduce the quality of the acoustic windows required for transthoracic echocardiography, and postoperative pain limits the left lateral decubitus position needed for standard parasternal and apical views. Assessments at 24 and 48 hours were therefore selected to obtain measurements under more comparable imaging conditions.
An experienced cardiologist performed transthoracic echocardiography 24 and 48 hours after initiation of DTDS monitoring, using a Vivid S5 ultrasound system (GE Vingmed Ultrasound, Horten, Norway) with a 2.5-3.5 MHz transducer, with the patient in the left lateral decubitus position. Standard parasternal long-axis, parasternal short-axis, and apical four-chamber views were obtained. The recorded parameters are listed in .
Table 1. Comparison of echocardiographic parameters at 24 and 48 hours
Parameter | n | 24 h, mean±SD | 48 h, mean±SD | t | P | q |
|---|---|---|---|---|---|---|
IVSd (mm) | 41 | 10.55 ± 1.90 | 11.47 ± 2.71 | −2.307 | 0.026 | 0.129 |
LVEDD (mm) | 41 | 45.20 ± 3.80 | 45.06 ± 3.81 | 0.249 | 0.804 | 0.889 |
LVPWd (mm) | 41 | 10.85 ± 2.23 | 11.36 ± 2.52 | −1.528 | 0.134 | 0.353 |
IVSs (mm) | 41 | 13.84 ± 2.36 | 14.07 ± 2.52 | −0.589 | 0.559 | 0.736 |
LVESD (mm) | 41 | 28.73 ± 4.15 | 28.71 ± 3.82 | 0.035 | 0.972 | 0.972 |
LVPWs (mm) | 41 | 13.82 ± 2.52 | 14.32 ± 2.24 | −1.262 | 0.214 | 0.500 |
EF (%) | 41 | 62.76 ± 4.96 | 64.71 ± 4.03 | −3.541 | 0.001 | 0.011 |
FS (%) | 30 | 34.77 ± 5.44 | 35.60 ± 3.14 | −0.942 | 0.354 | 0.531 |
TR velocity (m/s) | 27 | 2.41 ± 0.26 | 2.47 ± 0.25 | −0.956 | 0.348 | 0.531 |
PR velocity (m/s) | 20 | 1.54 ± 0.35 | 1.76 ± 1.91 | −0.519 | 0.610 | 0.753 |
RVEDD (mm) | 39 | 34.88 ± 4.81 | 33.80 ± 4.92 | 1.155 | 0.255 | 0.505 |
Aortic velocity (m/s) | 41 | 1.18 ± 0.19 | 1.08 ± 0.16 | 2.791 | 0.008 | 0.056 |
Pulmonary velocity (m/s) | 41 | 1.06 ± 0.20 | 1.06 ± 0.19 | −0.052 | 0.959 | 0.972 |
IVC inspiratory diameter (cm) | 40 | 1.13 ± 0.42 | 1.19 ± 0.28 | −0.945 | 0.351 | 0.531 |
IVC expiratory diameter (cm) | 40 | 1.65 ± 0.37 | 1.69 ± 0.31 | −0.587 | 0.561 | 0.736 |
Caval index (%) | 40 | 32.09 ± 18.10 | 28.85 ± 13.34 | 1.133 | 0.264 | 0.505 |
SPAP (mmHg) | 36 | 27.67 ± 4.34 | 29.00 ± 2.76 | −1.986 | 0.055 | 0.192 |
Mitral E (m/s) | 30 | 0.81 ± 0.14 | 0.94 ± 0.16 | −4.080 | <0.001 | 0.007 |
Mitral A (m/s) | 30 | 0.58 ± 0.12 | 0.65 ± 0.14 | −2.271 | 0.031 | 0.129 |
LA area (cm2) | 41 | 27.85 ± 5.79 | 27.44 ± 4.06 | 0.417 | 0.679 | 0.792 |
RA area (cm2) | 41 | 24.73 ± 5.18 | 22.83 ± 5.50 | 1.586 | 0.121 | 0.353 |
Data are presented as mean±standard deviation. Measurements at 24 and 48 hours were compared using paired t-tests. The reported n represents the number of episodes with paired measurements available for each parameter. q denotes the P value adjusted by the Benjamini-Hochberg false discovery rate procedure across all 21 comparisons. EF: ejection fraction, FS: fractional shortening, IVC: inferior vena cava, IVSd: interventricular septal thickness in diastole, IVSs: interventricular septal thickness in systole, LA: left atrium, LVEDD: left ventricular end-diastolic diameter, LVESD: left ventricular end-systolic diameter, LVPWd: left ventricular posterior wall thickness in diastole, LVPWs: left ventricular posterior wall thickness in systole, PR: pulmonary regurgitation, RA: right atrium, RVEDD: right ventricular end-diastolic diameter, SPAP: systolic pulmonary artery pressure, TR: tricuspid regurgitation
The recorded echocardiographic parameters included interventricular septal thickness and left ventricular posterior wall thickness in systole and diastole, left ventricular end-diastolic and end-systolic diameters, left ventricular ejection fraction and fractional shortening, right ventricular end-diastolic diameter (RVEDD), right and left atrial dimensions and areas, aortic and pulmonary flow velocities, tricuspid and pulmonary regurgitation velocities, inspiratory and expiratory diameters of the inferior vena cava (IVC), caval index, systolic pulmonary artery pressure, and mitral E and A velocities. The cardiologist performing the echocardiographic examinations was not involved in DTDS management and did not have access to the device settings or recorded pressure and air-flow measurements.
Study Endpoints
The study was designed to characterize DTDS-derived pressure and flow measurements during the first 48 hours after chest tube placement, to assess changes in echocardiographic indices between 24 and 48 hours, and to examine the relationship between drainage-system measurements and echocardiographic changes. The protocol-defined primary endpoint was completion of 48 hours of DTDS monitoring with echocardiographic assessments at 24 and 48 hours. Associations between individual device-derived variables and echocardiographic change scores were examined as exploratory analyses rather than as separately prespecified primary endpoints.
Statistical Analysis
Statistical analyses were performed using SPSS version 25 (IBM Corp., Armonk, NY, USA). Decoding of the stored device files, calculation of the derived variables, false-discovery-rate correction, calculation of confidence intervals (CIs), and figure preparation were performed in Python (version 3.12) using pandas, NumPy, SciPy, and Matplotlib libraries. Continuous variables were expressed as mean±standard deviation for normally distributed data and as median [interquartile range (IQR)] for non-normally distributed data, as appropriate.
Echocardiographic measurements at 24 and 48 hours were compared using paired t-tests. Circuit pressure, preset suction level, air flow, and deviation from the preset level, measured at 0, 24, and 48 hours, were assessed using the Friedman test, followed by paired Wilcoxon signed-rank tests between time points. Associations between device-derived variables and echocardiographic change scores were assessed using Spearman rank correlation; the device-derived variables included baseline air leak and 24-48-hour changes in measured circuit pressure, air leak, and deviation from the preset level. Eight echocardiographic indices were selected to represent complementary domains of cardiac structure and function: interventricular septal thickness in diastole (IVSd), ejection fraction, aortic velocity, mitral E and A velocities, RVEDD, caval index, and systolic pulmonary artery pressure. These association analyses were exploratory; given the limited number of high-resolution, continuous time-series records and the availability of only two echocardiographic time points, associations were evaluated using change scores rather than multivariable longitudinal modelling.
All tests were two-sided, and P < 0.05 was considered statistically significant. The Benjamini-Hochberg false discovery rate procedure was applied to the 21 paired echocardiographic comparisons and the correlation analyses; both unadjusted P values and adjusted q values are reported. Spearman coefficients are presented with 95% CIs obtained by Fisher’s z transformation. Because two patients each contributed two episodes, a sensitivity analysis retaining only the first episode per patient was performed. Exploratory subgroup analyses compared 24-48-hour change scores by chest tube laterality (Mann-Whitney U test) and by diagnostic group (pneumothorax-related conditions, malignancy, and other conditions) (Kruskal-Wallis test), as the individual diagnostic categories were too small for meaningful comparison; within each subgroup family, P values for echocardiographic change parameters were adjusted by the Benjamini-Hochberg procedure. The relationship between measured circuit pressure and preset level was assessed by Pearson correlation at each time point separately, and the coefficient of determination was reported. Within-episode temporal trends were examined in episodes with an unchanged preset level: hourly mean pressures were calculated between 24 and 48 hours; an ordinary least-squares slope of pressure versus time was fitted within each episode and expressed as mmHg per 24 hours; and the slopes were tested against zero with a one-sample Wilcoxon signed-rank test.
RESULTS
A total of 41 chest tube drainage episodes in 39 patients were included. Because two patients each contributed two episodes, baseline characteristics are presented per episode (). Twenty-four episodes (58.5%) were in male patients and 17 (41.5%) in female patients; the mean age was 47.1 years (range, 18–80). Of the 41 drainage episodes, 18 (43.9%) occurred in patients with a history of smoking. The mean smoking exposure across the cohort was 13.34 pack-years, and a history of smoking was more prevalent in male than in female patients (66.7% vs. 11.76%). Surgery was performed in 31 episodes (75.6%), whereas 10 (24.4%) episodes were managed with tube thoracostomy alone, all in patients with pneumothorax-related conditions. Twelve episodes (29.3%) occurred in patients undergoing surgery for malignancy. Chest tubes were placed in the right hemithorax in 22 episodes (53.7%) and in the left hemithorax in 19 episodes (46.3%). The mean duration of DTDS use was 105.7 hours (range, 48–381), and cardiac comorbidity was present in nine (22.0%).
Table 2. Demographic and clinical characteristics
Variable | Value |
|---|---|
Total drainage episodes (n) | 41 |
Age (years), mean (min-max) | 47.10 (18–80) |
Sex, n (%) | Male: 24 (58.5%), female: 17 (41.5%) |
Height (cm), mean (min-max) | 168.80 (150–182) |
Weight (kg), mean (min-max) | 74.20 (49–110) |
Smoking history, n (%) | 18 (43.9%) |
Smoking exposure across the cohort (pack-years), mean | 13.34 |
Chest tube laterality, n (%) | Right: 22 (53.7%), left: 19 (46.3%) |
Surgery performed, n (%) | 31 (75.6%) |
Device duration (hours), mean (min-max) | 105.70 (48–381) |
Cardiac comorbidity, n (%) | 9 (22%) |
Cardiac comorbidity types | Hypertension: 6; acute rheumatic fever: 1; pericardial effusion: 1; coronary artery disease: 1 |
Primary disease categories | |
- Pneumothorax (spontaneous/iatrogenic/traumatic/hemopneumothorax) | 14 (34.1%) |
- Malignancy (lung cancer, metastasis, mesothelioma, thymoma) | 12 (29.3%) |
- Cystic/parenchymal diseases | 8 (19.5%) |
- Infectious conditions | 5 (12.2%) |
- Other | 2 (4.9%) |
Characteristics are presented per drainage episode. Two patients each contributed two separate drainage episodes, giving 41 episodes in 39 patients
min-max: minimum-maximum
All included episodes underwent at least 48 hours of DTDS monitoring. Continuous time-series records spanning the predefined 48-hour interval were available for 29 episodes, and analyses requiring these high-resolution data were restricted to this subset. The preset suction level was unchanged throughout the first 48 hours in 21 of the 29 episodes (72%); it changed once in 7 episodes and more than once in 1 episode. At each time point, the measured circuit pressure was closely related to the preset level (R2 = 0.838, 0.919, and 0.955 at 0, 24, and 48 hours). Measured circuit pressure was 13.74 ± 2.96 mmHg at 0 hours, 13.58 ± 3.23 mmHg at 24 hours and 13.26 ± 3.49 mmHg at 48 hours, with no significant difference between 24 and 48 hours (P = 0.12) (). Among the 21 episodes with an unchanged preset the median within-episode slope between 24 and 48 hours was +0.011 mmHg per 24 hours (P = 0.90), and was negative in 10 of the 21. Deviation from the preset level was +0.80 ± 1.49, +0.78 ± 1.08 and +0.63 ± 0.81 mmHg at 0, 24 and 48 hours, with no significant difference between 24 and 48 hours (P = 0.11).
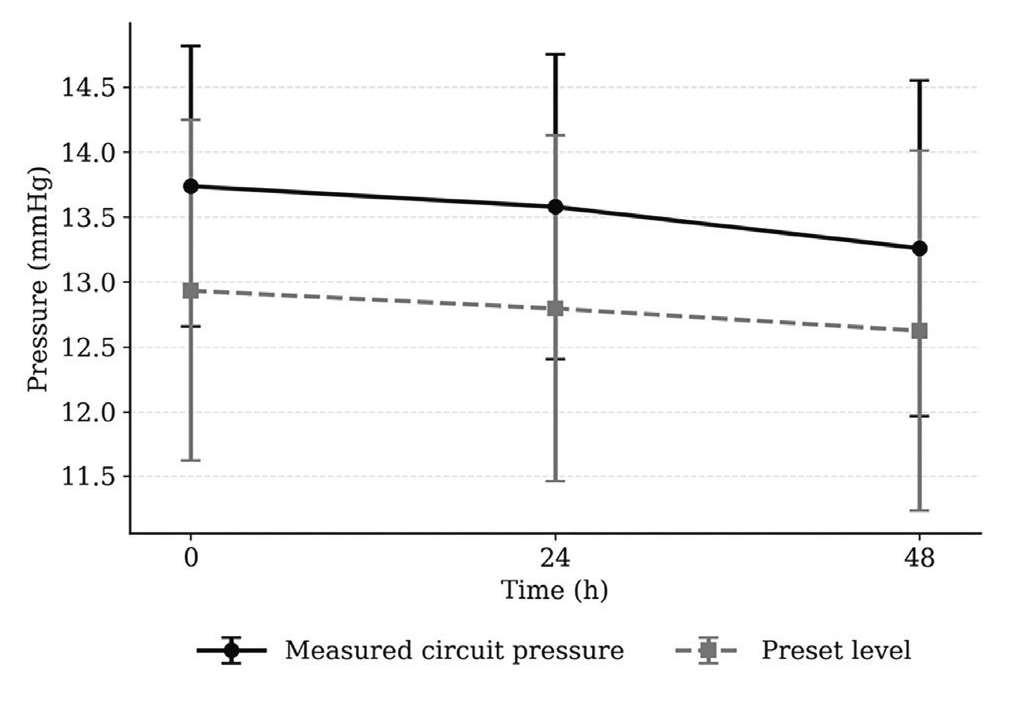
Measured circuit pressure and preset suction level at 0, 24 and 48 hours, expressed as the magnitude of the negative pressure (mmHg). Values were obtained from the stored device records as the mean of all recordings within 45 minutes of each time point. Points are means and error bars 95% confidence intervals. The high-resolution time-series analysis included 29 episodes; 28 contributed evaluable data within the predefined 48-hour window
Air leak decreased from a median of 61.6 mL/min (IQR 30.2–335.3) at 0 hours to 2.3 mL/min (IQR 1.4–35.8) at 24 hours (P < 0.001), with no further significant change at 48 hours (1.3 mL/min, IQR 1.1–12.5; P = 0.55) (, ).
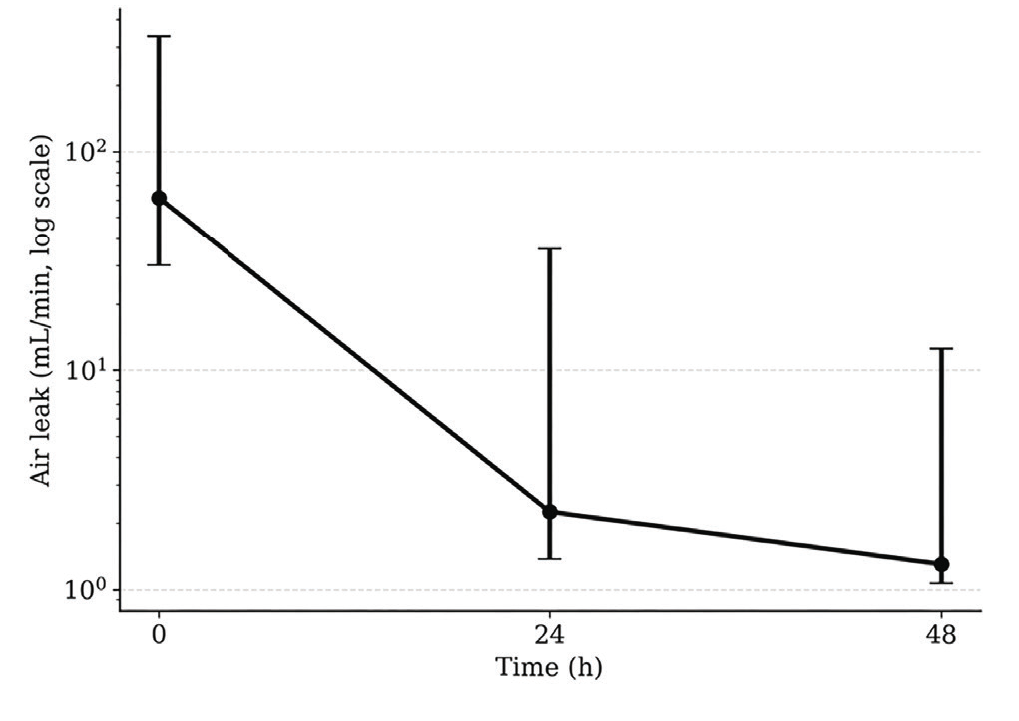
Air leak at 0, 24 and 48 hours (mL/min, logarithmic scale). Points are medians and error bars represent interquartile ranges. The high-resolution time-series analysis included 29 episodes; 28 contributed evaluable data within the predefined 48-hour window
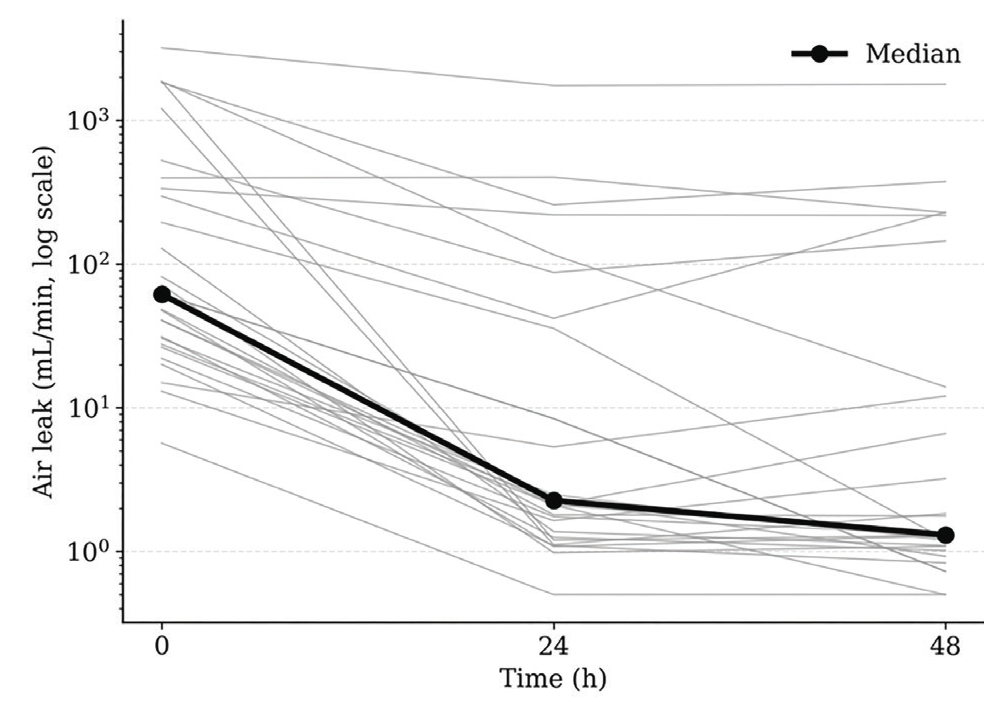
Individual air-leak trajectories over the first 48 hours (grey lines) with the cohort median (black line). The high-resolution time-series analysis included 29 episodes; 28 contributed evaluable data within the predefined 48-hour window
compares echocardiographic measurements at 24 and 48 hours. Before adjustment, IVSd, ejection fraction, and mitral E and A velocities were higher at 48 hours, whereas aortic velocity was lower at 48 hours. After false discovery rate correction across the 21 comparisons, mitral E velocity (q = 0.007) and ejection fraction (q = 0.011) remained statistically significant. However, the absolute changes were modest: mitral E velocity, +0.13 m/s; ejection fraction, +1.95 percentage points In the sensitivity analysis restricted to the first episode of each patient (n = 39), the same two parameters remained significant and no other parameter changed status.
Associations between device-derived variables and echocardiographic change scores are shown in . None of the 32 coefficients remained significant after false discovery rate correction. The largest coefficient was observed between air leak at 0 hours and the change in systolic pulmonary artery pressure (ρ = 0.490, 95% CI: 0.14 to 0.73, P = 0.009, q = 0.303). CIs for the remaining coefficients were wide and mostly included zero.
Table 3. Associations between device-derived variables and echocardiographic change scores
Exposure | Outcome (Δ24–48 h) | n | ρ | 95% CI | P | q |
|---|---|---|---|---|---|---|
Air leak at baseline | ΔSPAP | 27 | +0.490 | +0.14 to +0.73 | 0.009 | 0.303 |
Air leak at baseline | ΔCaval index | 28 | −0.416 | −0.68 to −0.05 | 0.028 | 0.442 |
Air leak at baseline | ΔMitral E | 24 | +0.218 | −0.20 to +0.57 | 0.306 | 0.817 |
Air leak at baseline | ΔAortic velocity | 29 | +0.142 | −0.24 to +0.48 | 0.463 | 0.964 |
Air leak at baseline | ΔMitral A | 24 | +0.113 | −0.30 to +0.49 | 0.599 | 0.964 |
Air leak at baseline | ΔEF | 29 | −0.072 | −0.43 to +0.30 | 0.709 | 0.964 |
Air leak at baseline | ΔRVEDD | 28 | −0.015 | −0.39 to +0.36 | 0.939 | 0.964 |
Air leak at baseline | ΔIVSd | 29 | +0.009 | −0.36 to +0.37 | 0.964 | 0.964 |
ΔAir leak (24–48 h) | ΔSPAP | 26 | −0.259 | −0.59 to +0.14 | 0.202 | 0.817 |
ΔAir leak (24–48 h) | ΔIVSd | 28 | +0.247 | −0.14 to +0.57 | 0.206 | 0.817 |
ΔAir leak (24–48 h) | ΔAortic velocity | 28 | −0.237 | −0.56 to +0.15 | 0.224 | 0.817 |
ΔAir leak (24–48 h) | ΔMitral E | 23 | −0.150 | −0.53 to +0.28 | 0.494 | 0.964 |
ΔAir leak (24–48 h) | ΔEF | 28 | +0.126 | −0.26 to +0.48 | 0.522 | 0.964 |
ΔAir leak (24–48 h) | ΔMitral A | 23 | +0.019 | −0.40 to +0.43 | 0.931 | 0.964 |
ΔAir leak (24–48 h) | ΔCaval index | 27 | +0.016 | −0.37 to +0.39 | 0.939 | 0.964 |
ΔAir leak (24–48 h) | ΔRVEDD | 27 | −0.012 | −0.39 to +0.37 | 0.952 | 0.964 |
ΔDeviation from preset (24–48 h) | ΔIVSd | 28 | +0.379 | +0.01 to +0.66 | 0.047 | 0.499 |
ΔDeviation from preset (24–48 h) | ΔEF | 28 | +0.221 | −0.17 to +0.55 | 0.258 | 0.817 |
ΔDeviation from preset (24–48 h) | ΔAortic velocity | 28 | +0.220 | −0.17 to +0.55 | 0.260 | 0.817 |
ΔDeviation from preset (24–48 h) | ΔMitral A | 23 | −0.232 | −0.59 to +0.20 | 0.286 | 0.817 |
ΔDeviation from preset (24–48 h) | ΔSPAP | 26 | −0.155 | −0.51 to +0.25 | 0.451 | 0.964 |
ΔDeviation from preset (24–48 h) | ΔRVEDD | 27 | +0.146 | −0.25 to +0.50 | 0.468 | 0.964 |
ΔDeviation from preset (24–48 h) | ΔCaval index | 27 | +0.088 | −0.30 to +0.45 | 0.663 | 0.964 |
ΔDeviation from preset (24–48 h) | ΔMitral E | 23 | −0.025 | −0.43 to +0.39 | 0.909 | 0.964 |
ΔMeasured pressure (24–48 h) | ΔAortic velocity | 28 | +0.253 | −0.13 to +0.57 | 0.194 | 0.817 |
ΔMeasured pressure (24–48 h) | ΔMitral A | 23 | −0.254 | −0.60 to +0.18 | 0.241 | 0.817 |
ΔMeasured pressure (24–48 h) | ΔEF | 28 | +0.091 | −0.29 to +0.45 | 0.645 | 0.964 |
ΔMeasured pressure (24–48 h) | ΔIVSd | 28 | +0.085 | −0.30 to +0.44 | 0.668 | 0.964 |
ΔMeasured pressure (24–48 h) | ΔCaval index | 27 | +0.084 | −0.31 to +0.45 | 0.678 | 0.964 |
ΔMeasured pressure (24–48 h) | ΔMitral E | 23 | −0.063 | −0.46 to +0.36 | 0.776 | 0.964 |
ΔMeasured pressure (24–48 h) | ΔSPAP | 26 | −0.054 | −0.43 to +0.34 | 0.792 | 0.964 |
ΔMeasured pressure (24–48 h) | ΔRVEDD | 27 | +0.047 | −0.34 to +0.42 | 0.817 | 0.964 |
Δ: change from 24 to 48 hours; ρ: Spearman’s rank correlation coefficient; q: P value adjusted by the Benjamini-Hochberg false discovery rate procedure across all 32 comparisons. Analyses requiring continuous time-series data were restricted to the 29 episodes with high-resolution records spanning the predefined 48-hour interval RVEDD: right ventricular end-diastolic diameter, IVSd: interventricular septal thickness in diastole, CI: confidence interval, SPAP: systolic pulmonary artery pressure, EF: ejection fraction
Changes between 24 and 48 hours in the device-derived variables did not differ between right- and left-sided drainage (measured circuit pressure, U = 122.0, P = 0.28; air leak, U = 67.0, P = 0.16; deviation from the preset level, U = 98.0, P = 1.00). A difference in the change in the caval index was observed between right- and left-sided drainage (median Δ -9.41% versus +2.41%; U = 126.0, P = 0.048), but it did not remain significant after adjustment across the 12 comparisons (q = 0.41). No other laterality-related differences were observed.
Exploratory disease-based analyses included pneumothorax-related conditions (n = 14), malignancies (n = 12), and other conditions (n = 15). Changes in the device-derived variables did not differ among groups (measured circuit pressure: H = 1.527, P = 0.47; air leak: H = 1.374, P = 0.50; deviation from the preset level: H = 2.018, P = 0.37). No between-group differences in echocardiographic change scores reached statistical significance before or after adjustment.
DISCUSSION
Chest tube placement aims to restore negative intrathoracic pressure. DTDS have emerged as an important alternative to conventional underwater and wall suction systems owing to their portability and quantitative output; recent meta-analyses report that they may reduce chest tube duration and hospital stay while supporting clinical decision-making through objective measurements.
Contemporary literature on cardiopulmonary interactions emphasizes that changes in intrathoracic pressure modulate cardiac performance by altering preload, afterload, and ventricular interdependence. Experimentally, a decrease in intrathoracic pressure during normal inspiration enhances venous return, and more negative intrathoracic pressure at rest and during moderate exercise increases systemic venous return and augments left ventricular filling and stroke volume. Testing this relationship during pleural drainage requires a measurement that varies with the state of the pleural space. In the present study, the recorded pressure was closely related to the physician-set level; when that level was unchanged, the recorded pressure remained essentially stable between 24 and 48 hours. This variable, therefore, appears to reflect the pressure the system was maintaining within the drainage circuit rather than a property of the pleural space, and is unlikely to be suitable as a measure of intrathoracic pressure for this purpose.
Kaplan et al. showed that elevated intrathoracic pressure from massive pleural effusion adversely affects cardiac function by compressing the pericardial space and reducing venous return, causing diastolic collapse of both ventricles before thoracentesis. In our study, neither left ventricular end-diastolic diameter nor right ventricular measurements changed significantly between 24 and 48 hours.
IVC diameter and the caval index are influenced by cardiopulmonary loading conditions and may indicate volume status and right atrial pressure; Mandeville and Colebourn demonstrated the value of respiratory changes in IVC diameter for assessing fluid responsiveness and right-sided filling. In our cohort, neither IVC diameters nor the caval index changed significantly between 24 and 48 hours. Experimental studies in healthy individuals show that enhanced negative intrathoracic pressure can increase venous return and alter ventricular filling, providing a framework for heart-lung interactions during changes in pleural pressure. Chidambaram et al. reported right atrial collapse before thoracentesis that resolved after pressure reduction. A decreasing trend in right atrial area was observed, but it did not reach statistical significance; given that the air leak had already decreased substantially by the time of the first echocardiogram, much of any associated change in right-sided filling may have occurred earlier than we were able to sample.
Right ventricular function is directly influenced by venous return,, and the thin-walled right ventricle is more sensitive to afterload change., Reed et al. reported increased right ventricular end-diastolic volume after pulmonary resection. In our study, right ventricular end-diastolic diameter showed a non-significant decrease between 24 and 48 hours; however, these measures are not directly comparable. The mild increase in systolic pulmonary artery pressure was likewise not statistically significant. These findings should be interpreted in the context of the multifactorial determinants of right ventricular performance.
Amar et al. reported a slight increase in pulmonary artery pressure after pulmonary resection without significant change in right atrial dimensions, and Cölkesen et al. found preserved left ventricular systolic function after major lung resection with increased mitral A velocity and decreased mitral E/A ratio. In our study, after correction for multiple comparisons, ejection fraction and mitral E velocity were higher at 48 hours, whereas the increase in mitral A velocity did not survive adjustment. These differences were small—approximately two percentage points in ejection fraction—and their clinical significance is therefore uncertain, warranting cautious interpretation. In the absence of any association with the device-derived variables, these echocardiographic changes cannot be linked to the drainage-system measurements in the present study.
Chest tube laterality was also explored. No differences in the device-derived variables were identified between right- and left-sided drainage. Although a nominal difference was observed in the change in the caval index, it did not remain significant after adjustment. Therefore, laterality did not appear to be a major determinant of the observed short-term changes, although the sample size was insufficient to exclude smaller side-specific effects.
In exploratory disease-based analyses, no differences in device-derived variables or changes in echocardiographic parameters were identified among pneumothorax-related conditions, malignancies, and other diseases, although the limited number of patients in each group precludes definitive disease-specific conclusions.
A distinctive aspect of this study is the use of the stored device records themselves, at a 10-minute sampling interval, alongside serial echocardiography. These records indicate that most of the change in the air leak occurred within the first 24 hours, with little further change, suggesting that the major change in the device-derived air-flow signal had already occurred before the first echocardiogram. This is not simply a matter of scheduling: the interval during which the pleural space is most abnormal is also when transthoracic echocardiography is most difficult to obtain, because intrapleural air and fluid degrade acoustic window quality, and postoperative pain limits lateral positioning. Early transthoracic imaging is expected to be most technically challenging during the first 24 hours, when residual intrapleural air and fluid may impair acoustic windows and reduce image and measurement quality. This practical limitation was an important reason for selecting the 24- and 48-hour echocardiographic assessments rather than routine imaging during the earliest phase after chest tube placement. Accordingly, the absence of associations between device-derived changes and echocardiographic changes from 24 to 48 hours should not be interpreted as evidence against a cardiopulmonary relationship during the earlier, more dynamic phase of drainage. Future studies should incorporate cardiac assessment within the first 24 hours, when technically feasible, potentially using approaches less dependent on acoustic windows and positioning, such as a focused subcostal echocardiographic protocol or non-invasive haemodynamic monitoring.
Study Limitations
The principal strength of this study is the prospective, concurrent collection of quantitative drainage data and serial echocardiographic measurements at standardized time points using stored device records rather than bedside transcription. Several limitations should be acknowledged. The sample size was small, and the heterogeneous indications for drainage introduced clinical variability that the exploratory subgroup analyses could not fully address. Drain position and configuration, and the relative contribution of air and fluid drainage, were not systematically recorded; the device measurements were not synchronised to the exact time of echocardiography or to the respiratory phase; and intra- and inter-observer reproducibility of the echocardiographic measurements was not assessed. Although all included episodes completed at least 48 hours of DTDS monitoring, continuous high-resolution time-series records spanning the predefined 48-hour interval were available for only 29 episodes; analyses requiring these data were therefore restricted to this subset. The specific technical reason for the absence of continuous high-resolution data in the remaining episodes was not documented, and time-series availability was not defined as a clinical grouping variable for baseline comparison. Therefore, selection bias related to the availability of these data cannot be excluded. Echocardiography was not performed before chest tube placement; consequently, the earliest phase of drainage-related change was not sampled, and assessment was limited to the first 48 hours. Two patients each contributed two episodes, although a sensitivity analysis restricted to first episodes did not alter the findings. The study was observational and not designed to establish causal effects; accordingly, causal conclusions cannot be drawn, and subgroup analyses were exploratory and underpowered. Finally, cardiac function was assessed exclusively by transthoracic echocardiography, and the absence of additional haemodynamic monitoring or complementary imaging limited the ability to independently validate the findings.
CONCLUSION
In this cohort, the pressure recorded by the DTDS appeared to reflect the level that the system was regulating to maintain, rather than a property of the pleural space. Air leak exhibited a marked early decline, whereas deviation from the preset level did not change significantly between 24 and 48 hours. Although ejection fraction and mitral E velocity were statistically higher at 48 hours, the absolute changes were modest and their clinical significance remains uncertain. Most of the observed change in air leak occurred before the first echocardiographic assessment, which may have limited our ability to detect associations between early drainage changes and subsequent echocardiographic change. These measurements should not be regarded as surrogate markers of cardiac function, but they may provide complementary physiological context during pleural drainage. Larger studies using assessment methods suited to the earliest hours after chest tube placement would be required to determine whether cardiac changes accompanying the restoration of negative intrathoracic pressure can be demonstrated.
Ethics
Ethics Committee Approval: This study was approved by the Necmettin Erbakan University Meram Faculty of Medicine Clinical Research Ethics Committee (approval no.: 2014/65; date: March 26, 2014) and conducted in accordance with the Declaration of Helsinki.
Informed Consent: Written informed consent was obtained from all participants.
Footnotes
Authorship Contributions
Concept - Design - Data Collection or Processing - Analysis or Interpretation - Literature Search - Writing: All authors contributed equally to this study.
Previous Presentation and Thesis Disclosure: This manuscript is derived from the corresponding author’s medical specialty thesis. The study was previously presented in abstract/poster form at the 25th Annual Meeting of the German Society of Thoracic Surgery, Freiburg, Germany, September 29-October 1, 2016.
Declaration Regarding the Use of AI and AI-Assisted Technologies: During the preparation of this manuscript, the authors used ChatGPT (OpenAI) for English-language editing and translation. All AI-assisted text was reviewed and revised by the authors, who take full responsibility for the content of the manuscript.
Conflict of Interest
The authors declare no conflict of interest.
Financial Disclosure
This study was supported by the Scientific Research Projects Coordination Unit of Necmettin Erbakan University.
References
Meyer JA. Gotthard Bülau and closed water-seal drainage for empyema, 1875-1891. Ann Thorac Surg. 1989;48(4):597-599.
Iberti TJ, Stern PM. Chest tube thoracostomy. Crit Care Clin. 1992;8(4):879-895.
Pickard LR, Beall AC. Portable suction device for use in patients with postoperative pleural air leaks. Ann Thorac Surg. 1983;36(1):103-104.
Pecora DV. Postthoracotomy suction. Chest. 1981;79(5):613-614.
Brunelli A, Monteverde M, Borri A, et al. Comparison of water seal and suction after pulmonary lobectomy: a prospective, randomized trial. Ann Thorac Surg. 2004;77(6):1932-1937.
Rathinam S, Bradley A, Cantlin T, Rajesh PB. Thopaz portable suction systems in thoracic surgery: an end user assessment and feedback in a tertiary unit. J Cardiothorac Surg. 2011;6:59.
Chang PC, Chen KH, Jhou HJ, et al. Promising effects of digital chest tube drainage system for pulmonary resection: a systematic review and network meta-analysis. J Pers Med. 2022;12(4):512.
de Araújo PHXN, de Macedo JPC, D’Ambrosio PD, Pêgo-Fernandes PM, Terra RM. Digital versus conventional chest drainage systems in resource-limited setting: a comparative analysis. Interdiscip Cardiovasc Thorac Surg. 2025;40:ivaf175.
Verkoulen KCHA, Laven IEWG, Daemen JHT, et al. From data to prediction: digital chest drain insights into postoperative recovery after lung cancer surgery. Lung Cancer. 2025;202:108486.
Guyton AC, Hall JE. Overview of the circulation: medical physics of pressure, flow, and resistance. In: Textbook of Medical Physiology. 10th ed. Philadelphia: WB Saunders; 2000.
Kaplan LM, Epstein SK, Schwartz SL, Cao QL, Pandian NG. Clinical, echocardiographic, and hemodynamic evidence of cardiac tamponade caused by large pleural effusions. Am J Respir Crit Care Med. 1995;151(3 Pt 1):904-908.
Zhou L, Guo K, Shang X, et al. Advantages of applying digital chest drainage system for postoperative management of patients following pulmonary resection: a systematic review and meta-analysis of 12 randomized controlled trials. Gen Thorac Cardiovasc Surg. 2023;71(1):1-11.
Hamahata N, Pinsky MR. Heart-lung interactions. Semin Respir Crit Care Med. 2023;44(5):650-660.
Brecher GA, Hubay CA. Pulmonary blood flow and venous return during spontaneous respiration. Circ Res. 1955;3(2):210-214.
Lalande S, Luoma CE, Miller AD, Johnson BD. Effect of changes in intrathoracic pressure on cardiac function at rest and during moderate exercise in health and heart failure. Exp Physiol. 2012;97(2):248-256.
Mandeville JC, Colebourn CL. Can transthoracic echocardiography predict fluid responsiveness in critically ill patients? A systematic review. Crit Care Res Pract. 2012;2012:513480.
Cheyne WS, Gelinas JC, Eves ND. The haemodynamic response to incremental increases in negative intrathoracic pressure in healthy humans. Exp Physiol. 2018;103(4):581-589.
Chidambaram S, Sangareddi V, Ganesan G, et al. An echocardiographic assessment of cardiovascular hemodynamics in patients with large pleural effusion. Indian Heart J. 2013;65:666-670.
Friedman BJ, Holman BL. Scintigraphic prediction of pulmonary arterial systolic pressure by regional right ventricular ejection fraction. Am J Cardiol. 1982;50(5):1114-1119.
Brown KA, Okada RD, Boucher CA, Strauss HW, Pohost GM. Right ventricular ejection fraction response to exercise in patients with coronary artery disease: influence of both right coronary artery disease and exercise-induced changes in right ventricular afterload. J Am Coll Cardiol. 1984;3(4):895-901.
Brent BN, Berger HJ, Matthay RA, Mahler D, Pytlik L, Zaret BL. Physiologic correlates of right ventricular ejection fraction in chronic obstructive pulmonary disease: a combined radionuclide and hemodynamic study. Am J Cardiol. 1982;50(2):255-262.
Weitzenblum E, Chaouat A. Right ventricular function in COPD: can it be assessed reliably by the measurement of right ventricular ejection fraction?. Chest. 1998;113(3):567-569.
Reed CE, Spinale FG, Crawford FA Jr. Effect of pulmonary resection on right ventricular function. Ann Thorac Surg. 1992;53(4):578-582.
Amar D, Burt ME, Roistacher N, Reinsel RA, Ginsberg RJ, Wilson RS. Value of perioperative Doppler echocardiography in patients undergoing major lung resection. Ann Thorac Surg. 1996;61(2):516-520.
Cölkesen Y, Açil T, Findikçioğlu A, et al. Tissue Doppler evaluation of the effects of major lung resection on cardiac functions. Turk Kardiyol Dern Ars. 2009;37(5):317-320.