
Abstract
OBJECTIVE: This study aimed to identify demographic, clinical, and laboratory parameters associated with mortality among patients admitted to the respiratory intensive care unit (RICU) for acute respiratory failure, and to develop an interpretable mortality classification model.
MATERIAL AND METHODS: This retrospective cohort included 765 patients admitted between January 2018 and January 2023. A CHAID tree was developed using admission variables and internally evaluated with 10-fold cross-validation. Classification measures and the area under the receiver operating characteristic curve (AUC) were calculated. Multivariable logistic regression complemented the tree analysis and was compared with APACHE II alone.
RESULTS: In-hospital mortality was 40.9% (313/765). CHAID selected APACHE II, albumin, platelet-to-neutrophil ratio (PNR), C-reactive protein (CRP), and malignancy. The full-sample AUC was 0.816 [95% confidence interval (CI) 0.786–0.844]; sensitivity, specificity, and accuracy were 58.5%, 85.8%, and 74.6%, respectively. In stratified 10-fold cross-validation, sensitivity was 53.0%, specificity was 84.1%, positive predictive value was 69.7%, negative predictive value was 72.1%, and accuracy was 71.4%. In multivariable analysis, higher APACHE II, higher neutrophil-to-lymphocyte ratio, male sex, and malignancy were independently associated with mortality, whereas higher albumin and PNR were inversely associated with mortality. The combined logistic model outperformed APACHE II alone in repeated cross-validation (AUC difference 0.060, 95% CI 0.032–0.087; P < 0.001).
CONCLUSION: APACHE II was the principal mortality discriminator, while albumin, inflammatory cell ratios, CRP, and malignancy refined risk within specific severity strata. The internally evaluated models require external validation before clinical implementation.
Keywords: Acute respiratory failure, APACHE II, CHAID, mortality, respiratory intensive care unit
Main Points
• In-hospital mortality in this five-year respiratory intensive care unit cohort was 40.9%.
• APACHE II was the primary CHAID discriminator; albumin, platelet-to-neutrophil ratio, C-reactive protein, and malignancy refined the risk in selected branches.
• The CHAID model achieved 71.4% accuracy after stratified 10-fold cross-validation, but sensitivity remained limited.
• The combined logistic model provides greater discrimination than APACHE II alone and requires external validation.
INTRODUCTION
Intensive care units provide continuous monitoring and advanced organ support for patients with life-threatening conditions. Respiratory intensive care units (RICU) are specialized units primarily serving patients with acute respiratory failure and substantial mortality risk.
Acute respiratory failure may result from chronic obstructive pulmonary (COPD) exacerbation, pneumonia, pulmonary embolism, interstitial lung disease, acute respiratory distress syndrome, pulmonary edema, neuromuscular disease, drug- or toxin-induced respiratory depression, thoracic trauma, or postoperative complications. Prognosis is further influenced by comorbidity and acute illness severity.-
Reported RICU mortality varies with case mix, admission pathway, organ-support requirements, and institutional resources. Previous studies have associated mortality with cardiac comorbidity, high APACHE II, SAPS II and SOFA scores, invasive mechanical ventilation, hypoalbuminemia, anemia, immunosuppression and ventilator-associated infection.,-
This study examined admission, demographic, diagnostic, and laboratory factors associated with in-hospital mortality and developed an internally evaluated and interpretable CHAID classification model. Multivariable logistic regression was used to identify independent associations and assess information beyond APACHE II.
MATERIAL AND METHODS
Study Design and Population
This retrospective cohort included patients admitted to a tertiary RICU between January 2018 and January 2023 with acute respiratory failure, including acute-on-chronic respiratory failure. Patients admitted only for observation, those without acute respiratory failure, and those with insufficient electronic records were excluded.
Acute hypoxemic respiratory failure was defined as PaO2 <55 mmHg or SaO2 <88%. Acute hypercapnic respiratory failure was defined as PaCO2 >45 mmHg accompanied by an arterial pH <7.35. Admission arterial blood gas measurements were obtained on room air, except in patients with chronic type 1 respiratory failure, whose measurements were obtained while receiving supplemental oxygen at 5 L/min. In these patients, persistent PaO2 <55 mmHg or SaO2 <88% despite oxygen supplementation was classified as acute-on-chronic hypoxemic respiratory failure.
Variables and Outcome
Age, sex, primary admission diagnosis, and comorbidities were recorded. Admission measurements included C-reactive protein (CRP), urea, creatinine, total protein, albumin, white blood cell count, neutrophil count, lymphocyte count, platelet count, mean platelet volume, red cell distribution width, hemoglobin, pH, PaO2, PaCO2, HCO3-, SaO2, and APACHE II. SaO2 was obtained from the arterial blood gas analysis at admission under the oxygen conditions described above. Neutrophil-to-lymphocyte ratio (NLR), PLR, and platelet-to-neutrophil ratio (PNR) were recalculated from their component counts. NLR/PLR was excluded because it is equal to the neutrophil-to-platelet ratio and, therefore, is the reciprocal of PNR. The outcome was in-hospital death, with hospital discharge was coded as survival.
APACHE II score was obtained from the hospital information system using the most abnormal values recorded during the first 24 hours after ICU admission. Age and individual physiological components represented within APACHE II were not simultaneously entered into the primary multivariable model.
Vasopressor use was defined as the administration of norepinephrine or dopamine at any time during the ICU stay. Because vasopressor use and invasive mechanical ventilation could occur after admission, they were treated as clinical-course variables and excluded from the baseline prediction models.
Ethics
Ethical approval was obtained from the Non-interventional Clinical Research Ethics Committee of Aydın Adnan Menderes University Faculty of Medicine at its meeting held on September 4, 2025 with decision no: 7 and protocol no: 2025/258. Informed consent was waived because of the retrospective design.
Statistical Analysis
After the data were entered into the SPSS software, they were analyzed using the R Core Team (2026) (R: A language and environment for statistical computing. R Computing, Vienna, Austria) system. Continuous variables are reported as median (interquartile range [IQR]); categorical variables are reported as n (%). The Mann-Whitney U test and Pearson chi-square test were used for unadjusted comparisons. All tests were two-sided, and p<0.05 was considered statistically significant.
A CHAID analysis was performed using IBM SPSS statistics for Windows, version 25.0 (IBM Corp., Armonk, NY, USA). In-hospital mortality, coded as survival (0) or death (1), was the dependent variable. Candidate baseline variables included APACHE II, sex, primary admission diagnosis, malignancy, CRP, albumin, NLR, PNR, RDW, and SaO2. Pearson chi-square tests with Bonferroni adjustment were used; the splitting and merging alpha levels were both set at 0.05. The maximum tree depth was three, the minimum parent-node size was 25, and the minimum child-node size was 10. Ten intervals were used for continuous predictors; equal misclassification costs were specified; and no post-hoc pruning was applied. Missing values were retained according to the CHAID missing-category procedure. Internal validation was performed using stratified 10-fold cross-validation. Patients were randomly allocated to 10 folds while preserving the mortality proportion across folds. In each iteration, nine folds were used to develop the CHAID model and the remaining fold was used exclusively for testing. Each fold served once as the test set. The resulting out-of-fold predictions were pooled to construct a single confusion matrix and calculate sensitivity, specificity, positive and negative predictive values, overall accuracy, and misclassification risk. Full-sample terminal-node probabilities were used to calculate the apparent area under the receiver operating characteristic curve (AUC); its 95% confidence interval (CI) was obtained using 4000 patient-level bootstrap samples.
A complete-case multivariable logistic regression model included APACHE II, CRP, albumin, NLR, PNR, sex, primary diagnosis, malignancy, COPD, coronary artery disease, heart failure, diabetes mellitus, and chronic kidney disease. APACHE II was expressed per 5 points, CRP per 50 mg/L, and NLR and PNR were expressed per doubling. Stratified 10-fold cross-validation repeated 10 times was used for both the combined logistic model and APACHE II-alone comparator. AUC, classification measures, Brier score, calibration intercept, and calibration slope were calculated from out-of-fold probabilities. For both models, classification measures were calculated using a predicted probability threshold of 0.50. Patient-level bootstrap confidence intervals were used to estimate AUCs and paired AUC differences.
RESULTS
Study Population
Of 943 admissions screened, 178 observation admissions or those without acute respiratory failure were excluded, leaving 765 patients. Overall, 313 patients died and 452 survived, corresponding to a mortality of 40.9%. The cohort included 504 men (65.9%). Mortality was 44.6% among men and 33.7% among women (P = 0.004). Pneumonia was the most common admission diagnosis (394/765, 51.5%). Among patients with pneumonia, 193 of 394 (49.0%) died. The value 61.7% represents the proportion of deceased patients with pneumonia, not the mortality among patients with pneumonia ().
Table 1. Demographic, diagnostic, comorbidity and treatment characteristics according to outcome
Parameter and format | Overall (N = 765) | Deaths (n = 313) | Survivors (n = 452) | P value |
|---|---|---|---|---|
Male sex, n (%) | 504 (65.9%) | 225 (71.9%) | 279 (61.7%) | 0.004 |
Diagnosis: COPD exacerbation, n (%) | 130 (17.0%) | 36 (11.5%) | 94 (20.8%) | <0.001 |
Diagnosis: pneumonia, n (%) | 394 (51.5%) | 193 (61.7%) | 201 (44.5%) | |
Diagnosis: other, n (%) | 144 (18.8%) | 45 (14.4%) | 99 (21.9%) | |
Diagnosis: pulmonary embolism, n (%) | 79 (10.3%) | 31 (9.9%) | 48 (10.6%) | |
Diagnosis: interstitial lung disease, n (%) | 18 (2.4%) | 8 (2.6%) | 10 (2.2%) | |
Any comorbidity, n (%) | 674 (88.1%) | 279 (89.1%) | 395 (87.4%) | 0.463 |
Malignancy, n (%) | 182 (23.8%) | 111 (35.5%) | 71 (15.7%) | <0.001 |
Cerebrovascular disease, n (%) | 49 (6.4%) | 16 (5.1%) | 33 (7.3%) | 0.224 |
COPD comorbidity, n (%) | 190 (24.8%) | 59 (18.8%) | 131 (29.0%) | 0.001 |
Coronary artery disease, n (%) | 60 (7.8%) | 16 (5.1%) | 44 (9.7%) | 0.019 |
Heart failure, n (%) | 72 (9.4%) | 33 (10.5%) | 39 (8.6%) | 0.373 |
Hypertension, n (%) | 157 (20.5%) | 50 (16.0%) | 107 (23.7%) | 0.010 |
Diabetes mellitus, n (%) | 114 (14.9%) | 34 (10.9%) | 80 (17.7%) | 0.009 |
Chronic kidney disease, n (%) | 58 (7.6%) | 28 (8.9%) | 30 (6.6%) | 0.236 |
Vasopressor use, n (%) | 311 (40.7%) | 245 (78.3%) | 66 (14.6%) | <0.001 |
Invasive mechanical ventilation, n (%) | 356 (46.5%) | 295 (94.2%) | 61 (13.5%) | <0.001 |
Non-invasive ventilation, n (%) | 475/756 (62.8%) | 199/307 (64.8%) | 276/449 (61.5%) | 0.349 |
Diagnosis has a single overall Pearson chi-square P value. Treatment variables describe the ICU course and were excluded from baseline prediction models. Non-invasive ventilation data were available for 756 patients. ICU: intensive care unit, COPD: chronic obstructive pulmonary
Admission Findings
Patients who died had higher median values of CRP, urea, creatinine, WBC, neutrophil count, RDW, NLR, PLR, and APACHE II, and lower values of total protein, albumin, lymphocyte count, platelet count, hemoglobin, PaCO2, HCO3-, and PNR. PLR was higher and PNR was lower in the mortality group ().
Table 2. Continuous characteristics according to outcome
Parameter | Overall median (IQR) | Deaths median (IQR) | Survivors median (IQR) | Missing n | P value |
|---|---|---|---|---|---|
Age, years | 73.00 (64.00–81.00) | 74.00 (66.00–82.00) | 71.00 (63.00–79.00) | 0 | <0.001 |
C-reactive protein, mg/L | 86.80 (33.00–154.15) | 112.00 (66.05–181.80) | 62.20 (23.00–130.00) | 6 | <0.001 |
Urea, mg/dL | 53.00 (34.00–85.00) | 63.00 (41.75–97.00) | 48.00 (30.00–73.00) | 4 | <0.001 |
Creatinine, mg/dL | 0.87 (0.68–1.33) | 0.97 (0.73–1.66) | 0.83 (0.66–1.18) | 1 | <0.001 |
Total protein, g/dL | 5.95 (5.30–6.59) | 5.72 (5.10–6.32) | 6.09 (5.50–6.68) | 18 | <0.001 |
Albumin, g/dL | 2.96 (2.50–3.38) | 2.70 (2.30–3.13) | 3.10 (2.70–3.48) | 18 | <0.001 |
WBC, cells/µL | 11380 (8105–15808) | 13030 (9120–17958) | 10660 (7760–13825) | 3 | <0.001 |
Neutrophils, cells/µL | 9200 (5918–13255) | 10890 (7045–15818) | 8350 (5380–11228) | 3 | <0.001 |
Lymphocytes, cells/µL | 1015 (600–1600) | 840 (498–1400) | 1130 (710–1710) | 3 | <0.001 |
Platelets, cells/µL | 241000 (180000–327000) | 228500 (156250–318000) | 251500 (190250–327750) | 3 | 0.002 |
MPV, fL | 9.80 (8.90–11.00) | 9.80 (8.90–11.00) | 9.70 (8.80–10.97) | 11 | 0.365 |
RDW, % | 15.70 (14.20–17.90) | 16.00 (14.60–18.40) | 15.30 (14.00–17.50) | 8 | <0.001 |
Hemoglobin, g/dL | 11.00 (9.60–12.60) | 10.50 (9.07–12.10) | 11.40 (9.90–13.00) | 4 | <0.001 |
pH | 7.40 (7.33–7.46) | 7.41 (7.32–7.46) | 7.40 (7.33–7.45) | 8 | 0.576 |
PaO2, mmHg | 59.30 (45.35–80.65) | 59.70 (46.50–81.00) | 59.00 (45.05–80.45) | 14 | 0.745 |
PaCO2, mmHg | 42.00 (34.30–55.00) | 40.15 (32.00–50.92) | 43.40 (35.30–58.00) | 8 | 0.001 |
HCO3-, mmol/L | 25.20 (22.00–29.60) | 24.00 (20.45–29.15) | 26.00 (22.85–29.80) | 12 | <0.001 |
SaO2, % | 89.10 (79.85–95.20) | 89.00 (80.00–94.95) | 89.50 (79.50–95.80) | 11 | 0.874 |
APACHE II, points | 15.00 (10.00–22.00) | 20.00 (14.00–30.00) | 13.00 (9.00–17.00) | 3 | <0.001 |
NLR | 8.62 (4.31–17.15) | 12.56 (5.98–22.05) | 6.83 (3.65–13.15) | 3 | <0.001 |
PLR | 238.66 (141.00–397.98) | 267.75 (143.91–451.25) | 214.94 (138.25–348.67) | 3 | 0.005 |
PNR | 27.56 (17.92–41.71) | 21.73 (13.85–34.15) | 31.61 (21.04–45.41) | 3 | <0.001 |
IQR: interquartile range, WBC: white blood cell count, MPV: mean platelet volume, RDW: red cell distribution width, NLR: neutrophil-to-lymphocyte ratio, PLR: platelet-to-lymphocyte ratio, PNR: platelet-to-neutrophil ratio
CHAID Model
CHAID selected APACHE II, albumin, PNR, CRP, and malignancy, producing 21 nodes, 13 terminal nodes, and a depth of 3. In-hospital mortality was 19.0% for APACHE II scores of ≤11, 40.1% in the branch containing scores of 12–24 and patients with missing scores, 65.5% for scores of 25–31, and 90.5% for scores of >31. Within the APACHE II ≤11 stratum, albumin and subsequently PNR or APACHE II further separated risk. Within the branch containing APACHE II scores of 12–24 and patients with missing scores, CRP >65 mg/L was associated with higher mortality risk, and malignancy increased mortality from 43.5% to 69.2%. Within the APACHE II 25–31 stratum, malignancy increased mortality from 57.4% to 87.0%. Among patients with APACHE II >31, mortality was 96.4% with PNR ≤32.26 and 73.7% with PNR >32.26 ().
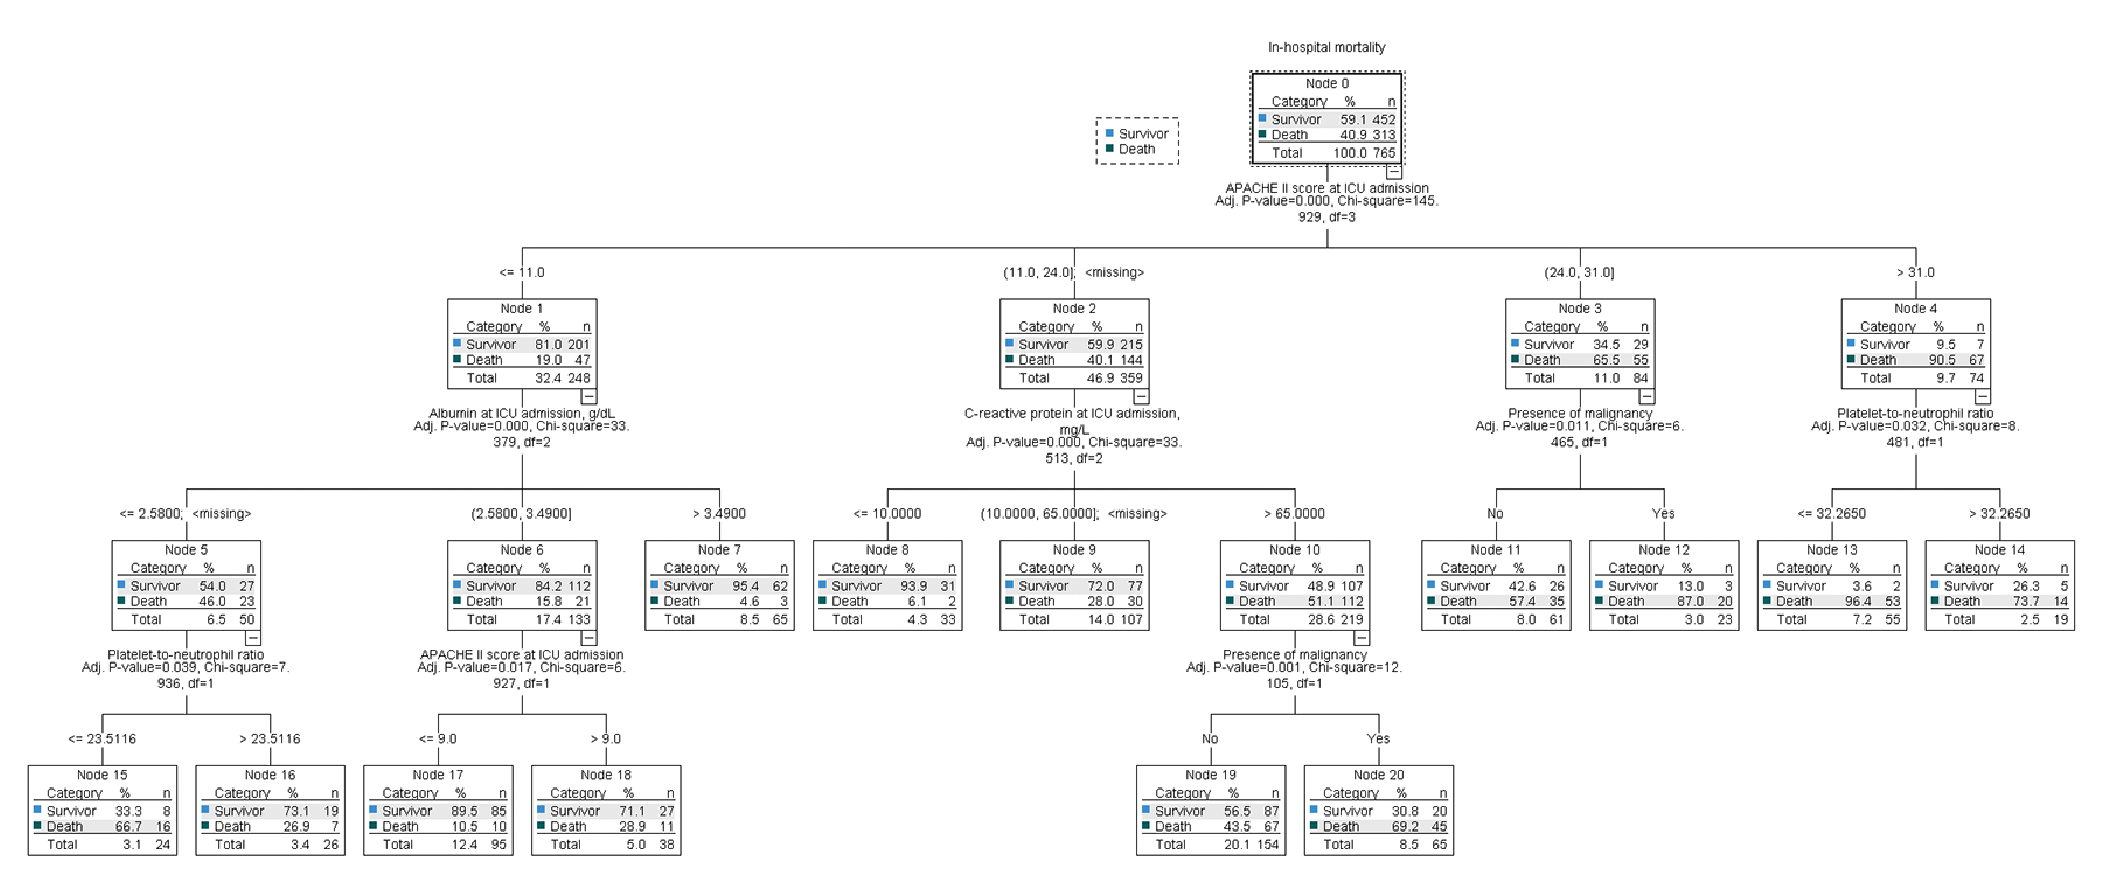
CHAID classification tree for in-hospital mortality
ICU: intensive care unit
The full-sample fitted tree had a misclassification risk of 0.254 and an accuracy of 74.6%. It correctly classified 183 of 313 patients who died and 388 of 452 patients who survived. Full-sample sensitivity was 58.5%, specificity 85.8%, positive predictive value (PPV) 74.1%, and negative predictive value (NPV) 74.9%; the confusion matrix contained 388 true negatives, 64 false positives, 130 false negatives, and 183 true positives. The apparent full-sample AUC was 0.816 (95% CI 0.786–0.844). In stratified 10-fold cross-validation, all 765 patients received one out-of-fold prediction. The pooled test-set confusion matrix comprised 380 true negatives, 72 false positives, 147 false negatives, and 166 true positives. Cross-validated sensitivity, specificity, PPV, NPV, and accuracy were 53.0%, 84.1%, 69.7%, 72.1%, and 71.4%, respectively. The pooled out-of-fold misclassification risk was 0.286 ().
Table 3. Model performance
Model | AUC (95% CI) | Sensitivity | Specificity | PPV | NPV | Accuracy |
CHAID fitted tree | 0.816 (0.786–0.844) | 58.5% | 85.8% | 74.1% | 74.9% | 74.6% |
CHAID stratified 10-fold CV | — | 53.0% | 84.1% | 69.7% | 72.1% | 71.4% |
APACHE II alone | 0.739 (0.703–0.772) | 47.0% | 85.4% | 69.0% | 69.9% | 69.7% |
Combined logistic | 0.799 (0.767–0.829) | 60.1% | 81.9% | 69.6% | 74.7% | 72.9% |
For the APACHE II-alone and combined logistic regression models, classification measures were calculated from out-of-fold predicted probabilities using a threshold of 0.50. PPV: positive predictive value, NPV: negative predictive value, AUC: area under the receiver operating characteristic curve, CI: confidence interval
Multivariable Logistic Regression
The complete-case model included 742 patients. Higher APACHE II [adjusted odds ratio (OR) per 5 points 1.66, 95% CI 1.48–1.86], higher NLR (per doubling OR 1.21, 95% CI 1.06–1.40), male sex (OR 1.74, 95% CI 1.16–2.60), and malignancy (OR 2.36, 95% CI 1.55–3.61) were independently associated with mortality. Higher albumin (OR 0.63, 95% CI 0.46–0.86) and higher PNR (per doubling, OR 0.77, 95% CI 0.65–0.92) were inversely associated. The inverse association with coronary artery disease should be interpreted with caution because of possible case-mix differences and residual confounding (, ).
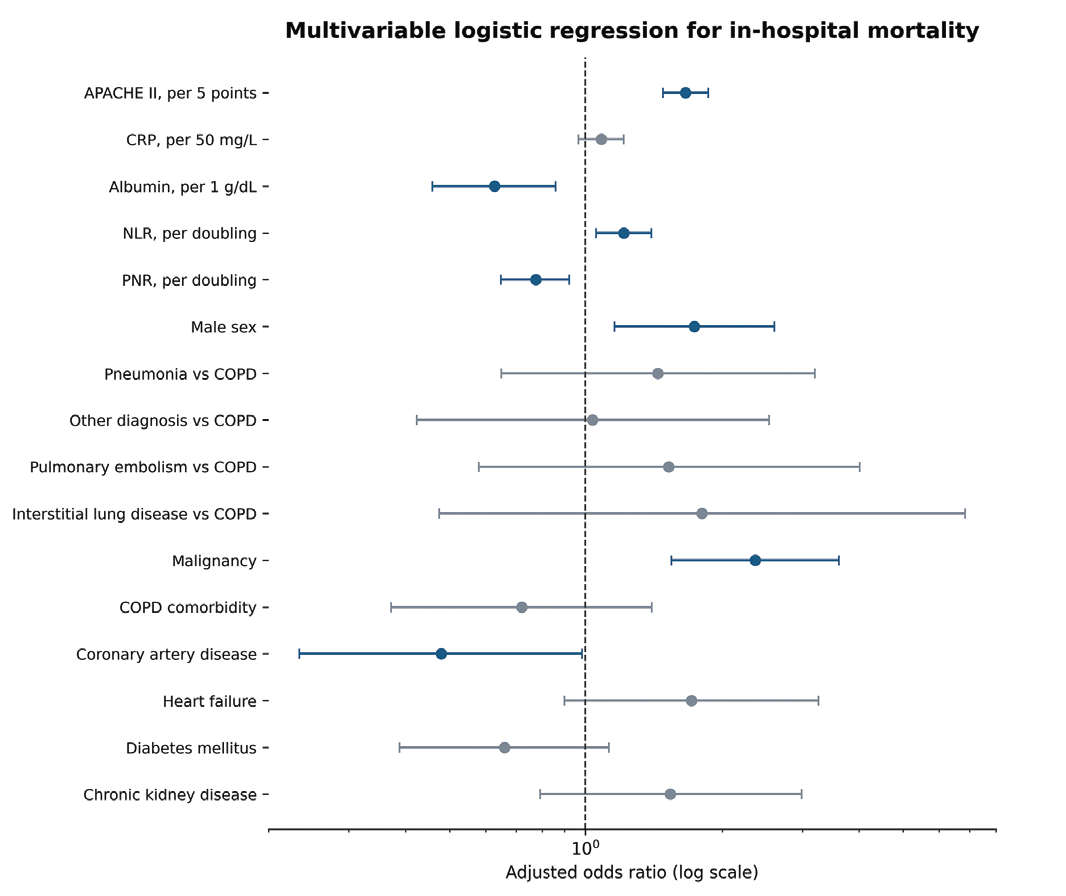
Multivariable logistic regression for in-hospital mortality. Adjusted odds ratios and 95% confidence intervals are shown on a logarithmic scale
CRP: C-reactive protein, COPD: chronic obstructive pulmonary
Table 4. Complete-case multivariable logistic regression for in-hospital mortality (n = 742)
Variable | Adjusted OR | 95% CI | P value |
|---|---|---|---|
APACHE II, per 5 points | 1.661 | 1.481–1.864 | <0.001 |
CRP, per 50 mg/L | 1.083 | 0.965–1.215 | 0.175 |
Albumin, per 1 g/dL | 0.628 | 0.458–0.861 | 0.004 |
NLR, per doubling | 1.214 | 1.055–1.396 | 0.007 |
PNR, per doubling | 0.773 | 0.649–0.922 | 0.004 |
Male vs. female | 1.737 | 1.158–2.605 | 0.008 |
Pneumonia vs. COPD diagnosis | 1.442 | 0.650–3.200 | 0.368 |
Other vs. COPD diagnosis | 1.037 | 0.424–2.535 | 0.937 |
Pulmonary embolism vs. COPD diagnosis | 1.525 | 0.579–4.012 | 0.393 |
Interstitial lung disease vs. COPD diagnosis | 1.803 | 0.475–6.847 | 0.386 |
Malignancy | 2.362 | 1.546–3.609 | <0.001 |
COPD comorbidity | 0.721 | 0.372–1.399 | 0.334 |
Coronary artery disease | 0.479 | 0.234–0.983 | 0.045 |
Heart failure | 1.711 | 0.899–3.258 | 0.102 |
Diabetes mellitus | 0.661 | 0.388–1.126 | 0.128 |
Chronic kidney disease | 1.538 | 0.791–2.989 | 0.204 |
CRP: C-reactive protein, NLR: neutrophil-to-lymphocyte ratio, PLR: platelet-to-lymphocyte ratio, PNR: platelet-to-neutrophil ratio, COPD: chronic obstructive pulmonary, CI: confidence interval
The repeated cross-validated AUC was 0.799 (95% CI 0.767–0.829) for the combined logistic model and 0.739 (95% CI 0.703–0.772) for APACHE II alone. The paired AUC difference was 0.060 (95% CI 0.032–0.087; P <0.001). The combined model had a Brier score of 0.176, a calibration intercept of −0.031, and a calibration slope of 0.914. At a 0.50 threshold, sensitivity was 60.1%, specificity 81.9%, PPV 69.6%, NPV 74.7%, and accuracy 72.9%.
Sensitivity Analyses
The primary admission diagnosis was entered as a candidate variable, but was not selected by the final CHAID model. Because the cohort was heterogeneous and the interstitial lung disease subgroup included only 18 patients, diagnosis-specific estimates were considered exploratory and not used to draw firm conclusions. SaO2 was not selected by the final model. Because measurements were obtained under varying oxygen conditions and detailed FiO2 data were unavailable, no SaO2 cut-off was recommended.
DISCUSSION
In this RICU cohort, in-hospital mortality was 40.9%. APACHE II was the dominant CHAID discriminator, while albumin, PNR, CRP, and malignancy refined risk within specific severity strata. Stratified 10-fold cross-validation reduced accuracy from 74.6% to 71.4% and increased the misclassification risk from 0.254 to 0.286, indicating moderate optimism in the fitted tree. Cross-validated specificity remained relatively high at 84.1%, whereas sensitivity was 53.0%. Thus, the model was more successful in identifying survivors than in identifying deaths and should be regarded as an interpretable risk-stratification tool rather than a stand-alone screening or clinical decision rule.
The two modelling approaches provided complementary information. Logistic regression identified independently associated factors after adjustment, whereas CHAID translated nonlinear relationships and interactions into clinically interpretable subgroups. APACHE II was central to both approaches. In logistic regression, Albumin, PNR, and malignancy were independently associated and also appeared in the CHAID tree. CRP was not independently significant in the logistic model but stratified risk within the branch containing APACHE II scores of 12–24 and patients with missing scores, suggesting a context-dependent, rather than uniform, prognostic value.
The prominence of APACHE II and the associations of albumin and inflammatory cell ratios with adverse outcomes are consistent with previous critical-care reports.-
The corrected pneumonia-specific mortality was 49.0% (193/394). The previously reported 61.7% represented the proportion of deceased patients with pneumonia. The diagnostic heterogeneity and the small size of the interstitial lung disease subgroup limit diagnosis-specific inferences.
PLR was higher and PNR was lower among patients who died. NLR/PLR was removed because it is mathematically equivalent to the neutrophil-to-platelet ratio and therefore is the reciprocal of PNR. Retaining both would introduce deterministic redundancy and could lead to misleading novelty claims.
Although the fitted CHAID tree had an AUC of 0.816, this estimate was calculated from the same cohort used to fit the displayed tree, and therefore represents apparent discrimination. The pooled out-of-fold accuracy (71.4%) and the misclassification risk (0.286) provide more appropriate estimates of internal validity. The combined logistic model improved repeated cross-validated discrimination over APACHE II alone, but neither model has undergone external validation.
SaO2 was not selected by the final tree. Its interpretation is limited because most measurements were obtained on room air, whereas patients with chronic type 1 respiratory failure were assessed during oxygen supplementation, and the exact FiO2 was unavailable. Likewise, vasopressor use and invasive ventilation occurred during the ICU course and were not treated as baseline predictors or causal exposures.
Study Limitations
This retrospective single-center study is susceptible to measurement error, residual confounding, and temporal changes in care. The cohort was clinically heterogeneous, and some terminal nodes and diagnostic subgroups were small. Detailed respiratory support information—including HFNC/HFNO, FiO2, PaO2/FiO2, ventilator settings, support duration, weaning, and tracheostomy—was not systematically available. Some blood gas measurements were obtained during supplemental oxygen, which limits direct comparison. Full-sample CHAID AUC and classification measures are apparent estimates. Internal validation using stratified 10-fold cross-validation provided pooled out-of-fold classification measures and a confusion matrix; however, a cross-validated AUC was not calculated for the CHAID model. Finally, internal validation does not replace independent external validation.
CONCLUSION
APACHE II was the principal discriminator of mortality in patients with acute respiratory failure admitted to an RICU. Albumin, PNR, CRP, and malignancy further characterized clinically interpretable risk strata, while multivariable logistic regression identified APACHE II, NLR, male sex, malignancy, albumin, and PNR as independent mortality-associated factors. The models demonstrate moderate performance on internal evaluation and require external validation before clinical use.
Ethics
Ethics Committee Approval: Ethical approval was obtained from the Non-interventional Clinical Research Ethics Committee of Aydın Adnan Menderes University Faculty of Medicine at its meeting held on September 4, 2025 with decision no: 7 and protocol no: 2025/258.
Informed Consent: Informed consent was waived because of the retrospective design.
Footnotes
Authorship Contributions
Concept: O.Y., H.A.U., M.T., Design: O.Y., H.A.U., M.T., Data Collection or Processing: O.Y., H.A.U., M.P., Ş.T.G., E.C., F.K., Analysis or Interpretation: M.T., Literature Search: O.Y., H.A.U., Writing: H.A.U.
Conflict of Interest
No conflict of interest was declared by the authors.
Financial Disclosure
The authors declared that this study received no financial support.
References
Marshall JC, Bosco L, Adhikari NK, et al. What is an intensive care unit? A report of the task force of the World Federation of societies of intensive and critical care medicine. J Crit Care. 2017;37:270-276.
Altıay G, Tabakoğlu E, Özdemir L, Tokuç B, Çevirme L, Hatipoğlu ON. Mortality rates and related factors in respiratory intensive care unit patients. Toraks Dergisi. 2007;8(2):79-84.
Sakr Y, Jaschinski U, Wittebole X, et al. Sepsis in intensive care unit patients: worldwide data from the intensive care over nations audit. OFID. 2018;5(12):ofy313.
Cao Y, Xing Z, Long H, et al. Predictors of mortality in COPD exacerbation cases presenting to the respiratory intensive care unit. Respir Res. 2021;22(1):77.
Valentini I, Pacilli AM, Carbonara P, et al. Influence of the admission pattern on the outcome of patients admitted to a respiratory intensive care unit: does a step-down admission differ from a step-up one? Respir Care. 2013;58(12):2053-2060.
Ozdemir P, Basarik B, Tasbakan MS, Gurgun A, Kacmaz Basoglu O, Bacakoglu F. Factors affecting mortality in a respiratory intensive care unit. Eur Respir J. 2011;38(Suppl 55):2058.
Kabak M. Factors affecting mortality in respiratory intensive care patients. Van Med J. 2019;26(1):85-90.
Ayyürek M, Menteş O, Yıldız M. Determinants of mortality in respiratory intensive care units. J Acad Res Med. 2025;15(2):55-63.
Knaus WA, Draper EA, Wagner DP, Zimmerman JE. APACHE II: a severity of disease classification system. Crit Care Med. 1985;13(10):818-829.
Karagoz I, Yoldas H. Platelet to lymphocyte and neutrophil to lymphocyte ratios as strong predictors of mortality in intensive care population. Rev Assoc Med Bras (1992). 2019;65(5):633-636.
Atrash AK, de Vasconcellos K. Low albumin levels are associated with mortality in the critically ill: a retrospective observational study in a multidisciplinary intensive care unit. South Afr J Crit Care. 2020;36(2):10.7196/SAJCC.2020.v36i2.422.
Naved SA, Siddiqui S, Khan FH. APACHE-II score correlation with mortality and length of stay in an intensive care unit. J Coll Physicians Surg Pak. 2011;21:4-8.