
Abstract
OBJECTIVE
This study presented the tracheal, bronchus, and lung cancer (TBLC) trend in adults ≥55 based on the Socio-demographic Index and geographical regions.
MATERIAL AND METHODS
We obtained annual TBLC data from 2010 to 2021 from the 2021 Global Burden of Disease (GBD) Study and analyzed the incidence, death rates, and disability-adjusted life years (DALYs) rates across different geographical classifications of 204 national and territorial.
RESULTS
In adults ≥55 years, the TBLC incidence rate decreased from 2010 to 2021 by globally 20.9% and 9.6% in males, while increasing by 3.8% in females. Approximately 60% of TBLC cases occurred in Asian countries. European countries exhibit the highest incidence rate (169.16 per 100,000). Males across all continents showed a decreasing trend, only the Americas reported a decreasing trend for women, with a noted change of 17.3%. The Western Pacific Region (World Health Organization region), East Asia (GBD region), Monaco, and countries with advanced health systems reported the highest incidence, death, and DALY numbers and rates for all genders. World Bank Upper middle-income countries recorded the highest DALY numbers and rates, incidence, and death numbers, all showing a downward trend, similar to high-income countries.
CONCLUSION
The global burden of TBLC is predominantly in Asian countries (mainly East Asia), with a slower decrease in incidence, death, DALY, and burden rates. Therefore, reducing exposure to risk factors, expanding screening and diagnostic programs, especially for high-risk male smokers and females, and improving treatment procedures to reduce the progression of this cancer are urgent.
Keywords: 'Tracheal, bronchus, and lung cancer', socio-demographic index, incidence, death, burden
Main Points
• In 2021, more than 66% of new tracheal, bronchus, and lung cancer (TBLC) cases were in men globally.
• In adults’ ≥55 years, the TBLC incidence rate decreased from 2010 to 2021 globally by 20.9%.
• The TBLC incidence rate decreased by 9.6% in males and increased by 3.8% in females.
• Approximately 60% of TBLC cases occurred in Asian countries.
• European countries exhibiting the highest incidence rate.
INTRODUCTION
Tracheal, bronchus, and lung cancer (TBLC) presents a significant global health burden. In 2019, 2.26 million new cases and 2.04 million deaths were attributed to TBLC, resulting in 45.9 million disability-adjusted life years (DALYs). In addition, TBLC-related symptoms and treatment side effects can substantially diminish patients’ quality of life and functional status. Smoking is the main cause of TBLC, but environmental exposures like air pollution and occupational carcinogens are also significant. However, the relative contribution of each risk factor to mortality varies by sex, geography, and individual exposures. Despite advancements in cancer treatment and technology, socioeconomic and geographic disparities affect access to appropriate care for TBLC patients. Given the multifaceted nature of factors influencing TBLC burden, it is imperative to investigate their impact comprehensively. On the other hand, understanding the complex interplay of risk factors and their varying impact across demographics and regions is essential for developing targeted interventions to decrease the burden of TBLC worldwide.
Due to physiological changes in lung aging, the incidence of TBLC increases with age,, and TBLC is considered one of the most important health challenges in old age. Meanwhile, the symptoms of TBLC in old age are misleading and make screening and diagnosis challenging; a significant percentage of elderly people with TBLC do not show a desire to receive treatment services.- Given that the world population has shifted toward older ages, it is of particular importance to examine statistics related to TBLC as an old age disease. Because proper policymaking and optimal implementation of cancer management programs require up-to-date and complete data, this study aims to investigate the burden of TBLC in adults aged ≥55 years, based on gender disparities among Socio-demographic Index (SDI) classifications and different geographical divisions. This is done by using the most up-to-date data from the Global Burden of Disease (GBD) study 2021 and its trend from 2010 to 2021.
MATERIAL AND METHODS
This study extracted data from the GBD 2021 online platform on the incidence, deaths, and DALYs of TBLC ≥55 from 2010 to 2021, which covers 369 diseases across 204 countries. The data were classified under the International Classification of Diseases-10 code (C33, C34.0–C34.92, Z12.2, Z80.1–Z80.2, and Z85.1–Z85.20). Data were analyzed using classifications based on global trends, SDI, continents, World Bank regions, World Health Organization (WHO) regions, GBD regions, and national and territorial divisions by gender and age groups. Old age in the GBD begins at age 55 and extends to the age group of ≥70. Therefore, we decided to present data for individuals aged 55 and older. SDI is a measure that identifies where countries sit on the development spectrum and is expressed on a 0 to 100 scale; 0 being the lowest SDI value and 100 being the highest. SDI is based on three measures: lag-distributed income per capita, average years of schooling in ages 15 and older, and total fertility rate for females under age 25. Countries and territories are stratified into five groups based on SDI values: low SDI (<0.45), low-middle SDI (≥0.45 and <0.61), middle SDI (≥0.61 and <0.69), high-middle SDI (≥0.69 and <0.80), and high SDI (≥0.80). The World Bank classifies economies into four income groups (low, medium-low, medium-high, and high) based on per capita gross national income, using the Atlas method to account for exchange rate fluctuations. The study employs DALYs to measure the burden of TBLC, combining years of life lost due to premature death and years lived with disability. To calculate total DALYs, years of life lost and years lived with disability were estimated and combined. GBD 2021 defined a summary measure of personal health care access and quality for a given location as the Healthcare Access and Quality (HAQ) Index. HAQ Index is based on risk-standardized mortality rates from causes that, in the presence of high-quality health care, should not result in death-also known as amenable mortality. Based on HAQ, countries and territories are classified into four groups: Advanced Health System, Basic Health System, Limited Health System, and Minimal Health System.
Ethical Consideration
The Jahrom University of Medical Sciences Ethical Research Committee approved this study (approval no: IR.JUMS.REC.1401.094, date: 23.11.2022). Because utilizing anonymous online datasets, informed consent was not required.
Statistical Analysis
The incidence, mortality, and DALY rates were calculated per 100,000 population with a 95% confidence interval. Selected epidemiological metrics are delineated individually for each classification. Definitions of the terms utilized are available at: https://www.healthdata.org/terms-defined and https://www.healthdata.org/gbd/
RESULTS
The Global Trend of TBLC Among Aged ≥55 Years
In 2021, 2,021.521 new cases of TBLC were recorded globally, 66% in males and 34% in females. TBLC incidence rate (per 100,000) with a 5.1% decrease compared to 2010 reached 190.704 in 2021. Also, 1,808.810 deaths related to TBLC were recorded globally, 66.6% in males and 33.4% in females. TBLC death rate (per 100,000) with a 7.1% decrease compared to 2010 reached 121.725 in 2021. The DALYs numbers related to TBLC were recorded as 37,632.985, globally, 67.8% in males and 32.2% in females. TBLC DALY rate (per 100,000) with a 9.2% decrease compared to 2010 reached 2,532.526 in 2021. Between 2010 and 2021, the TBLC incidence, death, and DALY rates decreased by 9.6, 11.2, and 13.3% in males, respectively. In contrast, females recorded a 3.8, 2.3, and 0.7% increase in incidence, death, and DALY rates, respectively (, , and, ).
Table 1. Incidence of TBLC in ≥55 years old in 2021 and its changes from 2010 to 2021
Location | Both genders | Males | Females | ||||||
|---|---|---|---|---|---|---|---|---|---|
Incidence number | Incidence rate per 100,000 | Changes (2010-2021) | Incidence number | Incidence rate per 100,000 | Changes (2010-2021) | Incidence number | Incidence rate per 100,000 | Changes (2010-2021) | |
Global | 2021521 | 136.039 | -0.051 | 1334012 | 190.704 | -0.091 | 687509 | 87.417 | 0.038 |
- | (1826641_2220212) | (122.925_149.41) | (-0.135_0.034) | (1173641_1502454) | (167.779_214.784) | (-0.198_0.029) | (602528_761779) | (76.612_96.861) | (-0.051_0.142) |
SDI | - | - | - | - | - | - | - | - | - |
High SDI | 695752 | 201.660 | -0.109 | 419104 | 260.958 | -0.161 | 276647 | 150.017 | -0.032 |
- | (632877_730778) | (183.436_211.812) | (-0.137_-0.086) | (389630_438888) | (242.605_273.276) | (-0.19_-0.132) | (242064_295776) | (131.264_160.39) | (-0.062_-0.006) |
High-middle SDI | 646561 | 186.502 | -0.001 | 447354 | 281.754 | -0.073 | 199207 | 106.016 | 0.182 |
- | (565073_738061) | (162.997_212.896) | (-0.122_0.14) | (372730_528061) | (234.754_332.585) | (-0.228_0.105) | (166192_236098) | (88.446_125.649) | (-0.008_0.406) |
Low SDI | 20925 | 25.501 | 0.047 | 15046 | 37.409 | 0.015 | 5880 | 14.053 | 0.170 |
- | (17842_24404) | (21.743_29.74) | (-0.081_0.188) | (12703_17955) | (31.584_44.644) | (-0.113_0.172) | (4830_6851) | (11.543_16.374) | (-0.002_0.383) |
Low-middle SDI | 103032 | 42.737 | 0.043 | 72323 | 62.569 | 0.022 | 30710 | 24.471 | 0.130 |
- | (93995_113138) | (38.988_46.929) | (-0.07_0.144) | (66413_79644) | (57.457_68.904) | (-0.109_0.144) | (26657_34612) | (21.241_27.581) | (0.013_0.254) |
Middle SDI | 553323 | 117.764 | 0.041 | 378875 | 169.338 | 0.005 | 174448 | 70.879 | 0.153 |
- | (461703_641449) | (98.264_136.52) | (-0.124_0.215) | (301061_459098) | (134.559_205.194) | (-0.199_0.235) | (146345_205815) | (59.461_83.624) | (-0.034_0.378) |
World Bank income level | - | - | - | - | - | - | - | - | - |
World Bank high-income | 756867 | 193.124 | -0.107 | 467439 | 258.101 | -0.164 | 289427 | 137.299 | -0.016 |
- | (687279_791117) | (175.367_201.863) | (-0.129_-0.091) | (436661_485057) | (241.106_267.828) | (-0.186_-0.145) | (251864_309385) | (119.48_146.767) | (-0.042_0.007) |
World Bank low income | 20065 | 41.829 | -0.066 | 14134 | 61.810 | -0.075 | 5931 | 23.628 | -0.039 |
- | (15622_25292) | (32.567_52.727) | (-0.171_0.064) | (10925_18343) | (47.776_80.217) | (-0.178_0.075) | (4278_7622) | (17.043_30.366) | (-0.206_0.133) |
World Bank lower middle-income | 204928 | 46.489 | 0.031 | 147975 | 69.961 | 0.000 | 56952 | 24.837 | 0.148 |
- | (178963_227155) | (40.598_51.531) | (-0.098_0.135) | (129646_164293) | (61.295_77.676) | (-0.135_0.111) | (47588_65604) | (20.754_28.61) | (0.02_0.288) |
World Bank upper middle-income | 1037726 | 171.810 | 0.030 | 703147 | 248.081 | -0.020 | 334579 | 104.373 | 0.165 |
- | (870368_1217969) | (144.101_201.652) | (-0.135_0.206) | (557692_861192) | (196.762_303.841) | (-0.222_0.223) | (275202_398729) | (85.85_124.385) | (-0.046_0.419) |
Continents | - | - | - | - | - | - | - | - | - |
Africa | 41556 | 38.582 | -0.011 | 31111 | 60.396 | -0.010 | 10445 | 18.586 | 0.050 |
- | (36441_47343) | (33.833_43.955) | (-0.114_0.122) | (27337_35519) | (53.07_68.953) | (-0.121_0.141) | (8826_11903) | (15.705_21.181) | (-0.099_0.205) |
America | 320264 | 138.088 | -0.209 | 174764 | 163.517 | -0.237 | 145500 | 116.355 | -0.173 |
- | (293708_335006) | (126.638_144.445) | (-0.229_-0.191) | (164613_181694) | (154.02_170.001) | (-0.26_-0.217) | (128872_153723) | (103.057_122.93) | (-0.198_-0.15) |
Table 1. Continued | |||||||||
Location | Both genders | Males | Females | ||||||
Incidence number | Incidence rate per 100,000 | Changes (2010-2021) | Incidence number | Incidence rate per 100,000 | Changes (2010-2021) | Incidence number | Incidence rate per 100,000 | Changes (2010-2021) | |
Asia | 1207198 | 137.507 | 0.036 | 818012 | 193.518 | -0.002 | 389185 | 85.496 | 0.141 |
- | (1027784_1393003) | (117.071_158.672) | (-0.117_0.189) | (657720_980997) | (155.597_232.075) | (-0.191_0.213) | (325424_454644) | (71.489_99.876) | (-0.045_0.349) |
Europe | 449726 | 169.159 | -0.077 | 308258 | 262.897 | -0.156 | 141467 | 95.197 | 0.101 |
- | (420474_469822) | (158.156_176.718) | (-0.109_-0.048) | (290221_322467) | (247.514_275.014) | (-0.191_-0.124) | (127226_150238) | (85.614_101.099) | (0.062_0.139) |
WHO Regions | - | - | - | - | - | - | - | - | - |
African Region | 26886 | 32.276 | -0.039 | 18867 | 48.501 | -0.046 | 8019 | 18.061 | 0.034 |
- | (23986_30233) | (28.794_36.294) | (-0.128_0.068) | (16910_21457) | (43.471_55.16) | (-0.143_0.072) | (6783_9123) | (15.277_20.546) | (-0.1_0.175) |
Eastern Mediterranean Region | 41935 | 56.333 | -0.037 | 33332 | 86.299 | -0.059 | 8603 | 24.018 | 0.070 |
- | (36862_48146) | (49.519_64.677) | (-0.155_0.105) | (29062_38683) | (75.243_100.151) | (-0.185_0.101) | (7079_10248) | (19.765_28.612) | (-0.112_0.259) |
European Region | 456888 | 164.202 | -0.086 | 313519 | 255.369 | -0.163 | 143369 | 92.213 | 0.090 |
- | (426699_477162) | (153.352_171.488) | (-0.117_-0.057) | (295418_327900) | (240.625_267.082) | (-0.197_-0.133) | (128947_152150) | (82.937_97.861) | (0.051_0.126) |
Region of the Americas | 320264 | 138.088 | -0.209 | 174764 | 163.517 | -0.237 | 145500 | 116.355 | -0.173 |
- | (293708_335006) | (126.638_144.445) | (-0.229_-0.191) | (164613_181694) | (154.02_170.001) | (-0.26_-0.217) | (128872_153723) | (103.057_122.93) | (-0.198_-0.15) |
South-East Asia Region | 141386 | 45.774 | 0.070 | 97459 | 65.526 | 0.045 | 43927 | 27.430 | 0.144 |
- | (120733_158579) | (39.088_51.34) | (-0.083_0.203) | (84186_110334) | (56.602_74.183) | (-0.13_0.198) | (35304_51396) | (22.045_32.093) | (-0.007_0.296) |
Western Pacific Region | 1020528 | 204.484 | 0.051 | 687437 | 287.748 | 0.011 | 333090 | 128.027 | 0.160 |
- | (852097_1200801) | (170.736_240.606) | (-0.12_0.233) | (538078_846822) | (225.229_354.464) | (-0.205_0.266) | (270000_400439) | (103.778_153.914) | (-0.051_0.407) |
Health System Grouping Level | - | - | - | - | - | - | - | - | - |
Advanced Health System | 865692 | 183.297 | -0.103 | 554171 | 259.245 | -0.161 | 311521 | 120.500 | -0.005 |
- | (793798_901757) | (168.075_190.934) | (-0.124_-0.085) | (522373_575080) | (244.369_269.026) | (-0.184_-0.139) | (272657_332329) | (105.467_128.548) | (-0.033_0.017) |
Basic Health System | 1037237 | 156.528 | 0.033 | 695751 | 219.963 | -0.005 | 341486 | 98.595 | 0.139 |
- | (863044_1209508) | (130.24_182.525) | (-0.134_0.206) | (545234_853562) | (172.377_269.856) | (-0.212_0.247) | (283663_405417) | (81.9_117.054) | (-0.068_0.383) |
Limited Health System | 110509 | 33.509 | 0.058 | 78322 | 49.135 | 0.025 | 32187 | 18.890 | 0.194 |
- | (99227_123189) | (30.088_37.353) | (-0.095_0.19) | (69613_87243) | (43.672_54.731) | (-0.141_0.176) | (28051_37003) | (16.462_21.716) | (0.036_0.367) |
Minimal Health System | 6155 | 30.847 | 0.032 | 4458 | 47.156 | -0.001 | 1697 | 16.162 | 0.110 |
- | (4732_8415) | (23.717_42.175) | (-0.111_0.203) | (3312_6511) | (35.03_68.869) | (-0.145_0.178) | (1310_2127) | (12.474_20.261) | (-0.101_0.38) |
Location | Both genders | Males | Females | ||||||
Incidence number | Incidence rate per 100,000 | Changes (2010-2021) | Incidence number | Incidence rate per 100,000 | Changes (2010-2021) | Incidence number | Incidence rate per 100,000 | Changes (2010-2021) | |
GBD Region | - | - | - | - | - | - | - | - | - |
Central Europe, Eastern Europe, and Central Asia | 158210 | 139.200 | -0.083 | 116847 | 251.347 | -0.158 | 41363 | 61.580 | 0.130 |
(149274_166827) | (131.337_146.782) | (-0.131_-0.036) | (109046_123778) | (234.566_266.255) | (-0.215_-0.109) | (38125_44195) | (56.761_65.797) | (0.062_0.2) | |
Central Asia | 8883 | 61.052 | -0.245 | 7035 | 110.138 | -0.279 | 1848 | 22.645 | -0.153 |
- | (7934_9825) | (54.529_67.526) | (-0.321_-0.161) | (6237_7829) | (97.65_122.57) | (-0.355_-0.201) | (1640_2066) | (20.087_25.31) | (-0.252_-0.044) |
Central Europe | 74924 | 202.344 | 0.011 | 51121 | 315.904 | -0.081 | 23803 | 114.187 | 0.253 |
- | (69374_79915) | (187.354_215.824) | (-0.057_0.077) | (46938_54757) | (290.056_338.375) | (-0.149_-0.015) | (21711_25785) | (104.15_123.693) | (0.155_0.347) |
Eastern Europe | 74403 | 119.852 | -0.107 | 58692 | 245.376 | -0.170 | 15711 | 41.172 | 0.075 |
- | (67454_80970) | (108.659_130.43) | (-0.186_-0.029) | (52241_64937) | (218.408_271.484) | (-0.26_-0.084) | (14108_17298) | (36.97_45.33) | (-0.023_0.181) |
High-income | 691861 | 194.495 | -0.112 | 424106 | 258.003 | -0.164 | 267755 | 139.935 | -0.029 |
- | (626369_724173) | (176.084_203.578) | (-0.134_-0.094) | (392777_440963) | (238.944_268.258) | (-0.187_-0.144) | (232204_286604) | (121.355_149.786) | (-0.056_-0.006) |
Australasia | 15257 | 172.707 | -0.063 | 8652 | 205.931 | -0.108 | 6606 | 142.578 | 0.002 |
- | (13607_16731) | (154.02_189.387) | (-0.139_0.022) | (7746_9578) | (184.379_227.976) | (-0.204_-0.005) | (5708_7247) | (123.205_156.415) | (-0.069_0.085) |
High-income Asia Pacific | 148952 | 211.270 | 0.029 | 104651 | 323.420 | -0.011 | 44301 | 116.137 | 0.111 |
- | (128808_160986) | (182.697_228.337) | (-0.03_0.087) | (94133_111703) | (290.915_345.215) | (-0.07_0.045) | (34126_50605) | (89.464_132.662) | (0.024_0.186) |
High-income North America | 238470 | 211.909 | -0.214 | 125182 | 239.398 | -0.247 | 113288 | 188.049 | -0.178 |
- | (218679_250417) | (194.322_222.525) | (-0.234_-0.195) | (117851_130919) | (225.377_250.369) | (-0.271_-0.223) | (99655_120365) | (165.42_199.796) | (-0.203_-0.153) |
Southern Latin America | 15313 | 104.055 | -0.158 | 9959 | 151.383 | -0.230 | 5354 | 65.792 | 0.005 |
- | (14002_16597) | (95.147_112.78) | (-0.223_-0.08) | (9099_10796) | (138.306_164.11) | (-0.298_-0.158) | (4754_5917) | (58.418_72.717) | (-0.084_0.122) |
Western Europe | 273869 | 183.639 | -0.089 | 175662 | 254.760 | -0.173 | 98207 | 122.479 | 0.080 |
- | (251000_289406) | (168.305_194.057) | (-0.124_-0.057) | (162467_184723) | (235.624_267.902) | (-0.21_-0.137) | (86593_105674) | (107.995_131.792) | (0.036_0.119) |
Latin America and Caribbean | 67647 | 63.680 | -0.076 | 40387 | 82.915 | -0.129 | 27260 | 47.391 | 0.026 |
- | (61809_72854) | (58.185_68.582) | (-0.13_-0.023) | (37458_43429) | (76.902_89.16) | (-0.185_-0.069) | (24411_29522) | (42.439_51.324) | (-0.04_0.093) |
Andean Latin America | 5057 | 51.046 | -0.032 | 2781 | 58.751 | -0.059 | 2276 | 43.995 | 0.009 |
- | (3955_6224) | (39.919_62.826) | (-0.223_0.182) | (2188_3439) | (46.22_72.659) | (-0.25_0.155) | (1706_2836) | (32.99_54.817) | (-0.203_0.25) |
Caribbean | 10041 | 108.453 | -0.054 | 6712 | 154.337 | -0.069 | 3329 | 67.810 | -0.006 |
- | (8895_11264) | (96.069_121.661) | (-0.166_0.056) | (5885_7636) | (135.322_175.597) | (-0.19_0.045) | (2855_3798) | (58.154_77.358) | (-0.125_0.119) |
Central Latin America | 20093 | 46.983 | -0.126 | 11994 | 61.013 | -0.158 | 8099 | 35.048 | -0.061 |
- | (17757_22694) | (41.522_53.065) | (-0.217_-0.022) | (10444_13663) | (53.131_69.507) | (-0.258_-0.049) | (6975_9309) | (30.183_40.282) | (-0.173_0.056) |
Location | Both genders | Males | Females | ||||||
Incidence number | Incidence rate per 100,000 | Changes (2010-2021) | Incidence number | Incidence rate per 100,000 | Changes (2010-2021) | Incidence number | Incidence rate per 100,000 | Changes (2010-2021) | |
Tropical Latin America | 32456 | 73.267 | -0.040 | 18900 | 94.649 | -0.124 | 13555 | 55.717 | 0.115 |
- | (30008_34298) | (67.741_77.426) | (-0.08_0.001) | (17679_19936) | (88.534_99.837) | (-0.167_-0.074) | (12277_14483) | (50.464_59.531) | (0.059_0.17) |
North Africa and Middle East | 57987 | 76.064 | -0.052 | 46835 | 121.381 | -0.079 | 11152 | 29.621 | 0.072 |
- | (50384_67122) | (66.091_88.047) | (-0.179_0.104) | (40247_55213) | (104.308_143.095) | (-0.213_0.084) | (9313_13049) | (24.736_34.659) | (-0.116_0.268) |
North Africa and Middle East | 57987 | 76.064 | -0.052 | 46835 | 121.381 | -0.079 | 11152 | 29.621 | 0.072 |
- | (50384_67122) | (66.091_88.047) | (-0.179_0.104) | (40247_55213) | (104.308_143.095) | (-0.213_0.084) | (9313_13049) | (24.736_34.659) | (-0.116_0.268) |
South Asia | 75444 | 30.385 | 0.120 | 54583 | 44.856 | 0.060 | 20861 | 16.476 | 0.357 |
- | (63426_85929) | (25.545_34.608) | (-0.076_0.307) | (44305_62935) | (36.41_51.72) | (-0.155_0.269) | (17666_24390) | (13.953_19.264) | (0.113_0.63) |
South Asia | 75444 | 30.385 | 0.120 | 54583 | 44.856 | 0.060 | 20861 | 16.476 | 0.357 |
- | (63426_85929) | (25.545_34.608) | (-0.076_0.307) | (44305_62935) | (36.41_51.72) | (-0.155_0.269) | (17666_24390) | (13.953_19.264) | (0.113_0.63) |
Southeast Asia, East Asia, and Oceania | 945194 | 186.095 | 0.046 | 633796 | 260.209 | 0.010 | 311398 | 117.803 | 0.146 |
- | (776899_1113883) | (152.96_219.307) | (-0.142_0.242) | (485921_790433) | (199.498_324.518) | (-0.222_0.293) | (253934_374308) | (96.064_141.602) | (-0.083_0.418) |
East Asia | 836971 | 213.447 | 0.060 | 559211 | 294.799 | 0.023 | 277760 | 137.214 | 0.169 |
- | (676469_1012020) | (172.515_258.089) | (-0.147_0.286) | (415219_715425) | (218.891_377.151) | (-0.241_0.344) | (219672_341439) | (108.518_168.671) | (-0.088_0.477) |
Oceania | 936 | 75.821 | 0.035 | 675 | 104.490 | 0.023 | 260 | 44.298 | 0.082 |
- | (712_1289) | (57.697_104.419) | (-0.149_0.254) | (500_958) | (77.331_148.228) | (-0.164_0.259) | (191_363) | (32.468_61.819) | (-0.12_0.31) |
Southeast Asia | 107288 | 93.657 | -0.010 | 73910 | 138.841 | -0.026 | 33378 | 54.431 | 0.021 |
- | (88294_123475) | (77.076_107.787) | (-0.147_0.118) | (61861_86517) | (116.206_162.524) | (-0.178_0.127) | (25868_39814) | (42.185_64.927) | (-0.127_0.174) |
Sub-Saharan Africa | 25179 | 32.306 | -0.035 | 17458 | 48.360 | -0.040 | 7721 | 18.454 | 0.037 |
- | (22424_28362) | (28.771_36.39) | (-0.124_0.076) | (15514_19997) | (42.974_55.394) | (-0.139_0.08) | (6510_8808) | (15.56_21.053) | (-0.098_0.184) |
Central Sub-Saharan Africa | 3657 | 40.525 | 0.090 | 2672 | 64.810 | 0.046 | 985 | 20.100 | 0.154 |
- | (2612_5501) | (28.944_60.966) | (-0.137_0.369) | (1780_4271) | (43.176_103.613) | (-0.19_0.325) | (718_1312) | (14.654_26.764) | (-0.148_0.529) |
Eastern Sub-Saharan Africa | 7448 | 27.545 | 0.013 | 5166 | 40.112 | -0.026 | 2281 | 16.114 | 0.143 |
- | (6459_8794) | (23.887_32.526) | (-0.142_0.169) | (4375_6190) | (33.968_48.064) | (-0.202_0.152) | (1796_2752) | (12.685_19.439) | (-0.061_0.381) |
Southern Sub-Saharan Africa | 8232 | 84.559 | -0.104 | 5320 | 131.656 | -0.148 | 2912 | 51.137 | -0.009 |
- | (7487_9135) | (76.905_93.832) | (-0.186_-0.009) | (4708_6004) | (116.508_148.582) | (-0.243_-0.035) | (2545_3304) | (44.686_58.02) | (-0.132_0.119) |
Western Sub-Saharan Africa | 5843 | 18.177 | -0.004 | 4300 | 28.557 | 0.026 | 1542 | 9.028 | 0.088 |
- | (4876_6946) | (15.17_21.608) | (-0.127_0.154) | (3615_5113) | (24.008_33.959) | (-0.12_0.21) | (1204_1833) | (7.047_10.731) | (-0.092_0.303) |
SDI: socio-demographic index, TBLC: tracheal, bronchus, and lung cancer, WHO: World Health Organization
Table 2. Death of TBLC in ≥55 years old in 2021 and its changes from 2010 to 2021
- | Both genders | Males | Females | % Changes (2010-2021) | |||||
|---|---|---|---|---|---|---|---|---|---|
Death number | Death rate per 100,000 | Changes (2010-2021) | Death number | Death rate per 100,000 | Changes (2010-2021) | Death number | Death rate per 100,000 | ||
Global | 1808810 | 121.725 | -0.071 | 1203940 | 172.110 | -0.112 | 604871 | 76.910 | 0.023 |
- | (1632909_1986037) | (109.887_133.651) | (-0.153_0.013) | (1060249_1353298) | (151.568_193.462) | (-0.215_0.003) | (529955_670701) | (67.384_85.28) | (-0.068_0.124) |
SDI | - | - | - | - | - | - | - | - | - |
High SDI | 566616 | 164.230 | -0.112 | 345357 | 215.039 | -0.165 | 221259 | 119.982 | -0.030 |
- | (514794_597233) | (149.21_173.104) | (-0.14_-0.089) | (321174_361385) | (199.981_225.018) | (-0.193_-0.137) | (192124_237407) | (104.182_128.738) | (-0.062_-0.004) |
High-middle SDI | 582299 | 167.966 | -0.048 | 403726 | 254.276 | -0.116 | 178573 | 95.035 | 0.124 |
- | (511627_660153) | (147.58_190.423) | (-0.163_0.081) | (337465_472938) | (212.543_297.867) | (-0.26_0.049) | (149964_210287) | (79.809_111.913) | (-0.047_0.333) |
Low SDI | 22438 | 27.343 | 0.043 | 16134 | 40.115 | 0.012 | 6304 | 15.067 | 0.166 |
- | (19157_26265) | (23.346_32.008) | (-0.085_0.184) | (13646_19298) | (33.93_47.981) | (-0.121_0.165) | (5177_7388) | (12.373_17.658) | (-0.006_0.384) |
Low-middle SDI | 109722 | 45.512 | 0.036 | 76881 | 66.513 | 0.015 | 32841 | 26.169 | 0.122 |
- | (99966_120661) | (41.465_50.05) | (-0.077_0.138) | (70636_84716) | (61.11_73.292) | (-0.116_0.135) | (28508_37098) | (22.717_29.561) | (0.006_0.245) |
Middle SDI | 525850 | 111.917 | -0.015 | 360568 | 161.156 | -0.048 | 165282 | 67.155 | 0.085 |
- | (440585_608749) | (93.77_129.56) | (-0.163_0.141) | (287772_433959) | (128.62_193.958) | (-0.236_0.162) | (139632_193715) | (56.733_78.707) | (-0.081_0.297) |
World Bank income level | - | - | - | - | - | - | - | - | - |
World Bank high-income | 626018 | 162.533 | -0.111 | 392179 | 220.118 | -0.169 | 233838 | 112.968 | -0.014 |
- | (568180_655898) | (147.517_170.291) | (-0.133_-0.095) | (365014_406461) | (204.871_228.134) | (-0.189_-0.151) | (201889_250862) | (97.533_121.192) | (-0.041_0.007) |
World Bank low income | 21409 | 40.639 | -0.067 | 15049 | 60.407 | -0.075 | 6360 | 22.903 | -0.043 |
- | (16684_27216) | (31.67_51.663) | (-0.172_0.062) | (11657_19562) | (46.791_78.52) | (-0.176_0.075) | (4538_8223) | (16.342_29.615) | (-0.211_0.132) |
World Bank lower middle-income | 214183 | 50.487 | 0.027 | 154337 | 75.737 | -0.003 | 59846 | 27.147 | 0.139 |
- | (187232_237375) | (44.135_55.954) | (-0.102_0.129) | (134984_171526) | (66.24_84.172) | (-0.141_0.108) | (49854_69003) | (22.615_31.301) | (0.013_0.28) |
World Bank upper middle-income | 945308 | 151.829 | -0.028 | 641094 | 219.509 | -0.075 | 304214 | 92.032 | 0.097 |
- | (798105_1106833) | (128.187_177.772) | (-0.18_0.131) | (509699_781793) | (174.52_267.684) | (-0.264_0.146) | (253302_360235) | (76.63_108.979) | (-0.095_0.326) |
Continents | - | - | - | - | - | - | - | - | - |
Africa | 44412 | 41.233 | -0.017 | 33260 | 64.567 | -0.016 | 11152 | 19.845 | 0.040 |
- | (38953_50628) | (36.165_47.004) | (-0.118_0.116) | (29195_38124) | (56.676_74.01) | (-0.124_0.137) | (9422_12750) | (16.766_22.688) | (-0.108_0.195) |
America | 273626 | 117.980 | -0.200 | 152706 | 142.878 | -0.231 | 120921 | 96.699 | -0.159 |
- | (250592_286741) | (108.048_123.634) | (-0.222_-0.181) | (143216_158884) | (133.999_148.659) | (-0.253_-0.21) | (107198_128030) | (85.724_102.384) | (-0.184_-0.135) |
Asia | 1084447 | 123.525 | -0.007 | 736097 | 174.139 | -0.043 | 348349 | 76.525 | 0.092 |
- | (922965_1246915) | (105.131_142.031) | (-0.151_0.141) | (593111_882222) | (140.313_208.708) | (-0.225_0.167) | (291907_405627) | (64.126_89.108) | (-0.085_0.294) |
Europe | 403667 | 151.834 | -0.087 | 280133 | 238.910 | -0.162 | 123534 | 83.129 | 0.091 |
- | (376617_421943) | (141.66_158.709) | (-0.118_-0.058) | (263696_292863) | (224.892_249.767) | (-0.198_-0.131) | (110439_131653) | (74.317_88.592) | (0.052_0.124) |
- | Both genders | Males | Females | % Changes (2010-2021) | |||||
Death number | Death rate per 100,000 | Changes (2010-2021) | Death number | Death rate per 100,000 | Changes (2010-2021) | Death number | Death rate per 100,000 | ||
WHO Regions | - | - | - | - | - | - | - | - | - |
African Region | 28698 | 34.451 | -0.045 | 20120 | 51.722 | -0.050 | 8578 | 19.319 | 0.024 |
- | (25638_32262) | (30.777_38.729) | (-0.133_0.064) | (18069_22935) | (46.449_58.958) | (-0.146_0.068) | (7255_9804) | (16.34_22.08) | (-0.108_0.167) |
Eastern Mediterranean Region | 45076 | 60.553 | -0.044 | 35838 | 92.786 | -0.066 | 9238 | 25.792 | 0.062 |
- | (39671_51738) | (53.292_69.502) | (-0.162_0.097) | (31310_41579) | (81.063_107.65) | (-0.189_0.092) | (7601_10984) | (21.223_30.667) | (-0.117_0.248) |
European Region | 410799 | 147.638 | -0.095 | 285364 | 232.436 | -0.170 | 125434 | 80.678 | 0.079 |
- | (383052_429581) | (137.666_154.388) | (-0.127_-0.067) | (269234_298225) | (219.297_242.911) | (-0.204_-0.14) | (112256_133582) | (72.202_85.918) | (0.04_0.112) |
Region of the Americas | 273626 | 117.980 | -0.200 | 152706 | 142.878 | -0.231 | 120921 | 96.699 | -0.159 |
- | (250592_286741) | (108.048_123.634) | (-0.222_-0.181) | (143216_158884) | (133.999_148.659) | (-0.253_-0.21) | (107198_128030) | (85.724_102.384) | (-0.184_-0.135) |
South-East Asia Region | 149227 | 48.313 | 0.060 | 102636 | 69.007 | 0.036 | 46591 | 29.093 | 0.132 |
- | (127373_167292) | (41.238_54.161) | (-0.089_0.191) | (88586_116132) | (59.561_78.081) | (-0.138_0.186) | (37479_54510) | (23.403_34.038) | (-0.017_0.281) |
Western Pacific Region | 888144 | 177.959 | -0.001 | 598886 | 250.682 | -0.039 | 289258 | 111.180 | 0.102 |
- | (738679_1042408) | (148.01_208.869) | (-0.168_0.171) | (468194_737822) | (195.977_308.839) | (-0.248_0.211) | (235036_347349) | (90.339_133.508) | (-0.103_0.346) |
Health System Grouping Level | - | - | - | - | - | - | - | - | - |
Advanced Health System | 729231 | 154.404 | -0.106 | 474485 | 221.967 | -0.165 | 254745 | 98.538 | -0.002 |
- | (666188_761007) | (141.055_161.132) | (-0.128_-0.087) | (445938_493326) | (208.613_230.781) | (-0.188_-0.144) | (222127_272230) | (85.921_105.301) | (-0.031_0.02) |
Basic Health System | 953998 | 143.966 | -0.027 | 640528 | 202.504 | -0.063 | 313470 | 90.506 | 0.071 |
- | (798590_1107650) | (120.514_167.153) | (-0.18_0.133) | (505842_781342) | (159.923_247.023) | (-0.253_0.163) | (263446_369619) | (76.063_106.718) | (-0.12_0.288) |
Limited Health System | 117102 | 35.508 | 0.050 | 82881 | 51.995 | 0.017 | 34222 | 20.084 | 0.182 |
- | (105226_130499) | (31.907_39.57) | (-0.102_0.179) | (73724_92328) | (46.25_57.921) | (-0.147_0.167) | (29807_39274) | (17.493_23.049) | (0.026_0.348) |
Minimal Health System | 6593 | 33.043 | 0.026 | 4771 | 50.472 | -0.008 | 1822 | 17.350 | 0.105 |
- | (5058_9047) | (25.348_45.342) | (-0.119_0.202) | (3552_6952) | (37.578_73.536) | (-0.147_0.171) | (1397_2296) | (13.308_21.867) | (-0.104_0.382) |
GBD Region | - | - | - | - | - | - | - | - | - |
Central Europe, Eastern Europe, and Central Asia | 150860 | 132.733 | -0.097 | 110971 | 238.706 | -0.173 | 39889 | 59.387 | 0.120 |
(142404_158787) | (125.293_139.707) | (-0.141_-0.052) | (103788_117408) | (223.256_252.552) | (-0.227_-0.127) | (36725_42578) | (54.675_63.391) | (0.056_0.184) | |
- | Both genders | Males | Females | % Changes (2010-2021) | |||||
Death number | Death rate per 100,000 | Changes (2010-2021) | Death number | Death rate per 100,000 | Changes (2010-2021) | Death number | Death rate per 100,000 | ||
Central Asia | 9109 | 62.605 | -0.261 | 7180 | 112.416 | -0.294 | 1929 | 23.631 | -0.176 |
- | (8144_10065) | (55.974_69.179) | (-0.334_-0.181) | (6358_7953) | (99.55_124.514) | (-0.368_-0.219) | (1713_2154) | (20.983_26.392) | (-0.269_-0.071) |
Central Europe | 74575 | 201.401 | 0.013 | 50792 | 313.870 | -0.082 | 23783 | 114.092 | 0.265 |
- | (69151_79336) | (186.754_214.26) | (-0.052_0.076) | (46712_54314) | (288.661_335.637) | (-0.149_-0.017) | (21677_25710) | (103.99_123.336) | (0.172_0.352) |
Eastern Europe | 67176 | 108.211 | -0.139 | 52999 | 221.577 | -0.200 | 14177 | 37.151 | 0.031 |
- | (61079_72932) | (98.389_117.482) | (-0.214_-0.065) | (47449_58260) | (198.373_243.571) | (-0.283_-0.119) | (12739_15580) | (33.382_40.829) | (-0.061_0.128) |
High-income | 561913 | 157.964 | -0.114 | 349411 | 212.563 | -0.167 | 212502 | 111.058 | -0.030 |
- | (508470_590518) | (142.94_166.005) | (-0.137_-0.097) | (324274_362986) | (197.271_220.821) | (-0.188_-0.149) | (182869_228329) | (95.571_119.33) | (-0.058_-0.008) |
Australasia | 11554 | 130.792 | -0.092 | 6741 | 160.438 | -0.127 | 4814 | 103.907 | -0.042 |
- | (10292_12717) | (116.497_143.946) | (-0.166_-0.008) | (6032_7455) | (143.577_177.446) | (-0.215_-0.027) | (4166_5305) | (89.911_114.514) | (-0.111_0.027) |
High-income Asia Pacific | 112940 | 160.191 | 0.045 | 79137 | 244.570 | 0.005 | 33803 | 88.615 | 0.127 |
- | (96202_122466) | (136.45_173.702) | (-0.011_0.096) | (70914_84035) | (219.155_259.707) | (-0.041_0.05) | (25676_38993) | (67.309_102.221) | (0.046_0.194) |
High-income North America | 188320 | 167.345 | -0.211 | 101358 | 193.837 | -0.243 | 86962 | 144.350 | -0.175 |
- | (172395_198522) | (153.193_176.41) | (-0.232_-0.192) | (95110_105954) | (181.888_202.625) | (-0.27_-0.221) | (76277_92754) | (126.614_153.964) | (-0.2_-0.151) |
Southern Latin America | 15778 | 107.213 | -0.172 | 10278 | 156.232 | -0.239 | 5500 | 67.584 | -0.020 |
- | (14424_17161) | (98.016_116.617) | (-0.234_-0.095) | (9431_11146) | (143.364_169.42) | (-0.308_-0.167) | (4882_6104) | (59.989_75.012) | (-0.105_0.087) |
Western Europe | 233320 | 156.450 | -0.099 | 151897 | 220.295 | -0.179 | 81423 | 101.547 | 0.065 |
- | (212064_246994) | (142.196_165.618) | (-0.133_-0.066) | (140457_159822) | (203.703_231.788) | (-0.214_-0.147) | (70954_87822) | (88.491_109.528) | (0.023_0.101) |
Latin America and Caribbean | 70597 | 66.458 | -0.087 | 41724 | 85.661 | -0.139 | 28873 | 50.196 | 0.011 |
- | (64558_76143) | (60.773_71.678) | (-0.141_-0.034) | (38584_44880) | (79.213_92.14) | (-0.192_-0.082) | (25745_31373) | (44.757_54.542) | (-0.053_0.079) |
Andean Latin America | 5439 | 54.906 | -0.055 | 2991 | 63.182 | -0.081 | 2448 | 47.332 | -0.014 |
- | (4247_6628) | (42.874_66.907) | (-0.243_0.154) | (2334_3677) | (49.308_77.675) | (-0.269_0.135) | (1829_3058) | (35.366_59.117) | (-0.217_0.23) |
Caribbean | 9558 | 103.231 | -0.070 | 6107 | 140.434 | -0.092 | 3450 | 70.278 | -0.017 |
- | (8476_10756) | (91.545_116.176) | (-0.178_0.032) | (5382_6866) | (123.765_157.888) | (-0.205_0.012) | (2976_3926) | (60.622_79.976) | (-0.13_0.1) |
Central Latin America | 21342 | 49.904 | -0.138 | 12696 | 64.588 | -0.169 | 8646 | 37.412 | -0.076 |
- | (18903_24063) | (44.201_56.266) | (-0.229_-0.039) | (11076_14471) | (56.343_73.617) | (-0.268_-0.062) | (7411_9959) | (32.071_43.096) | (-0.188_0.039) |
Tropical Latin America | 34258 | 77.336 | -0.049 | 19930 | 99.804 | -0.130 | 14329 | 58.895 | 0.100 |
- | (31582_36215) | (71.295_81.753) | (-0.089_-0.006) | (18588_21030) | (93.082_105.314) | (-0.173_-0.081) | (12907_15329) | (53.053_63.006) | (0.045_0.154) |
- | Both genders | Males | Females | % Changes (2010-2021) | |||||
Death number | Death rate per 100,000 | Changes (2010-2021) | Death number | Death rate per 100,000 | Changes (2010-2021) | Death number | Death rate per 100,000 | ||
North Africa and Middle East | 62269 | 81.682 | -0.058 | 50281 | 130.314 | -0.085 | 11988 | 31.841 | 0.063 |
- | (54488_72079) | (71.475_94.55) | (-0.184_0.098) | (43336_59239) | (112.315_153.53) | (-0.217_0.079) | (10014_13939) | (26.598_37.025) | (-0.121_0.26) |
North Africa and Middle East | 62269 | 81.682 | -0.058 | 50281 | 130.314 | -0.085 | 11988 | 31.841 | 0.063 |
- | (54488_72079) | (71.475_94.55) | (-0.184_0.098) | (43336_59239) | (112.315_153.53) | (-0.217_0.079) | (10014_13939) | (26.598_37.025) | (-0.121_0.26) |
South Asia | 79596 | 32.057 | 0.111 | 57538 | 47.285 | 0.052 | 22058 | 17.422 | 0.342 |
- | (66946_90425) | (26.962_36.418) | (-0.084_0.294) | (46646_66292) | (38.334_54.479) | (-0.159_0.256) | (18694_25775) | (14.765_20.358) | (0.103_0.612) |
South Asia | 79596 | 32.057 | 0.111 | 57538 | 47.285 | 0.052 | 22058 | 17.422 | 0.342 |
- | (66946_90425) | (26.962_36.418) | (-0.084_0.294) | (46646_66292) | (38.334_54.479) | (-0.159_0.256) | (18694_25775) | (14.765_20.358) | (0.103_0.612) |
Southeast Asia, East Asia, and Oceania | 856734 | 168.678 | -0.019 | 575428 | 236.246 | -0.052 | 281305 | 106.419 | 0.075 |
- | (707838_1006822) | (139.363_198.229) | (-0.191_0.164) | (442793_715500) | (181.792_293.753) | (-0.265_0.207) | (231638_335834) | (87.629_127.047) | (-0.135_0.325) |
East Asia | 742883 | 189.452 | -0.012 | 497183 | 262.100 | -0.047 | 245700 | 121.376 | 0.090 |
- | (600890_895412) | (153.241_228.351) | (-0.207_0.194) | (371156_635002) | (195.662_334.754) | (-0.293_0.246) | (195934_301544) | (96.791_148.963) | (-0.148_0.379) |
Oceania | 999 | 80.941 | 0.029 | 722 | 111.783 | 0.017 | 276 | 47.028 | 0.073 |
- | (759_1382) | (61.46_111.976) | (-0.164_0.256) | (531_1029) | (82.141_159.28) | (-0.173_0.254) | (201_388) | (34.215_65.929) | (-0.137_0.31) |
Southeast Asia | 112852 | 98.514 | -0.023 | 77523 | 145.629 | -0.040 | 35329 | 57.613 | 0.007 |
- | (92675_130034) | (80.9_113.513) | (-0.158_0.106) | (64911_90474) | (121.936_169.956) | (-0.188_0.109) | (27315_42107) | (44.543_68.666) | (-0.135_0.161) |
Sub-Saharan Africa | 26841 | 34.439 | -0.040 | 18586 | 51.484 | -0.045 | 8256 | 19.732 | 0.028 |
- | (23894_30298) | (30.657_38.873) | (-0.13_0.07) | (16551_21344) | (45.847_59.123) | (-0.143_0.075) | (6970_9434) | (16.659_22.547) | (-0.107_0.178) |
Central Sub-Saharan Africa | 3863 | 42.808 | 0.081 | 2816 | 68.309 | 0.037 | 1047 | 21.359 | 0.145 |
- | (2751_5728) | (30.482_63.482) | (-0.145_0.365) | (1864_4526) | (45.215_109.804) | (-0.198_0.318) | (759_1418) | (15.484_28.936) | (-0.161_0.535) |
Eastern Sub-Saharan Africa | 7993 | 29.563 | 0.011 | 5549 | 43.089 | -0.026 | 2444 | 17.259 | 0.139 |
- | (6934_9422) | (25.647_34.848) | (-0.145_0.167) | (4711_6646) | (36.582_51.603) | (-0.199_0.147) | (1923_2956) | (13.58_20.878) | (-0.067_0.372) |
Southern Sub-Saharan Africa | 8679 | 89.148 | -0.113 | 5569 | 137.813 | -0.156 | 3110 | 54.614 | -0.022 |
- | (7892_9621) | (81.065_98.827) | (-0.193_-0.02) | (4937_6273) | (122.169_155.231) | (-0.248_-0.045) | (2711_3517) | (47.615_61.765) | (-0.141_0.103) |
Western Sub-Saharan Africa | 6307 | 19.621 | -0.010 | 4651 | 30.891 | 0.021 | 1655 | 9.688 | 0.079 |
- | (5288_7499) | (16.451_23.33) | (-0.131_0.146) | (3909_5520) | (25.96_36.658) | (-0.124_0.203) | (1299_1967) | (7.605_11.512) | (-0.1_0.296) |
SDI: socio-demographic index, TBLC: tracheal, bronchus, and lung cancer, WHO: World Health Organization
Table 3. Burden of TBLC in ≥55 years old in 2021 and its changes from 2010 to 2021
- | Both genders | Males | Changes (2010-2021) | Females | Changes (2010-2021) | ||||
|---|---|---|---|---|---|---|---|---|---|
DALY number | DALY rate per 100,000 | Changes (2010-2021) | DALY number | DALY rate per 100,000 | DALY number | DALY rate per 100,000 | |||
Global | 37632985 | 2532.526 | -0.092 | 25527865 | 3649.352 | -0.133 | 12105120 | 1539.174 | 0.007 |
- | (33897815_41367880) | (2281.166_2783.867) | (-0.175_-0.003) | (22421782_28746491) | (3205.319_4109.472) | (-0.236_-0.015) | (10799610_13346792) | (1373.178_1697.054) | (-0.09_0.111) |
SDI | - | - | - | - | - | - | - | - | - |
High SDI | 10792988 | 3128.284 | -0.151 | 6684375 | 4162.062 | -0.206 | 4108613 | 2227.971 | -0.061 |
- | (10005640_11267790) | (2900.076_3265.902) | (-0.174_-0.13) | (6296548_6982975) | (3920.58_4347.987) | (-0.232_-0.179) | (3677289_4344500) | (1994.077_2355.884) | (-0.089_-0.036) |
High-middle SDI | 12375134 | 3569.641 | -0.071 | 8743270 | 5506.714 | -0.135 | 3631864 | 1932.845 | 0.100 |
- | (10857873_14081882) | (3131.983_4061.957) | (-0.185_0.059) | (7333050_10300126) | (4618.525_6487.258) | (-0.279_0.029) | (3071972_4280983) | (1634.875_2278.3) | (-0.077_0.307) |
Low SDI | 531329 | 647.505 | 0.045 | 383439 | 953.372 | 0.014 | 147891 | 353.477 | 0.165 |
- | (450859_625379) | (549.44_762.119) | (-0.085_0.191) | (320621_462061) | (797.185_1148.856) | (-0.122_0.174) | (122508_173716) | (292.81_415.202) | (-0.008_0.383) |
Low-middle SDI | 2561649 | 1062.559 | 0.038 | 1816661 | 1571.675 | 0.017 | 744988 | 593.638 | 0.126 |
- | (2328237_2826848) | (965.741_1172.562) | (-0.08_0.143) | (1659387_2006821) | (1435.609_1736.19) | (-0.117_0.141) | (644455_845617) | (513.529_673.823) | (0.005_0.254) |
Middle SDI | 11330969 | 2411.571 | -0.038 | 7872000 | 3518.392 | -0.069 | 3458969 | 1405.400 | 0.064 |
- | (9498761_13120367) | (2021.622_2792.408) | (-0.188_0.118) | (6286261_9507920) | (2809.646_4249.567) | (-0.253_0.143) | (2945011_4042403) | (1196.575_1642.453) | (-0.103_0.274) |
World Bank income level | - | - | - | - | - | - | - | - | - |
World Bank high-income | 11990750 | 3113.167 | -0.150 | 7626601 | 4280.581 | -0.209 | 4364150 | 2108.335 | -0.044 |
- | (11112158_12425474) | (2885.057_3226.034) | (-0.168_-0.134) | (7218473_7867798) | (4051.511_4415.958) | (-0.228_-0.192) | (3896101_4611811) | (1882.219_2227.981) | (-0.068_-0.023) |
World Bank low income | 504793 | 958.214 | -0.064 | 360168 | 1445.697 | -0.072 | 144626 | 520.844 | -0.037 |
- | (390955_643948) | (742.122_1222.361) | (-0.171_0.067) | (275522_473148) | (1105.932_1899.195) | (-0.176_0.082) | (104173_185762) | (375.16_668.99) | (-0.205_0.144) |
World Bank lower middle-income | 5060236 | 1192.806 | 0.034 | 3684724 | 1808.179 | 0.004 | 1375512 | 623.960 | 0.154 |
- | (4403727_5609606) | (1038.053_1322.305) | (-0.098_0.14) | (3223864_4101232) | (1582.024_2012.57) | (-0.135_0.119) | (1133792_1595101) | (514.311_723.571) | (0.017_0.307) |
World Bank upper middle-income | 20039185 | 3218.568 | -0.056 | 13830414 | 4735.493 | -0.100 | 6208771 | 1878.297 | 0.068 |
- | (16910136_23501422) | (2716_3774.651) | (-0.208_0.106) | (11037818_16968317) | (3779.316_5809.902) | (-0.284_0.12) | (5149757_7361950) | (1557.921_2227.16) | (-0.125_0.297) |
Continents | - | - | - | - | - | - | - | - | - |
Africa | 1051133 | 975.899 | -0.013 | 792427 | 1538.334 | -0.012 | 258706 | 460.354 | 0.050 |
- | (915828_1200187) | (850.278_1114.285) | (-0.119_0.126) | (692495_910200) | (1344.336_1766.967) | (-0.124_0.144) | (217076_297011) | (386.276_528.517) | (-0.105_0.212) |
America | 5518481 | 2379.404 | -0.210 | 3130441 | 2928.981 | -0.245 | 2388040 | 1909.685 | -0.160 |
- | (5156140_5739149) | (2223.173_2474.549) | (-0.23_-0.19) | (2972652_3248259) | (2781.346_3039.217) | (-0.267_-0.224) | (2175171_2509784) | (1739.456_2007.042) | (-0.185_-0.138) |
Asia | 22589353 | 2573.068 | -0.033 | 15591105 | 3688.398 | -0.067 | 6998247 | 1537.372 | 0.066 |
- | (19058755_26066482) | (2170.911_2969.135) | (-0.181_0.12) | (12566132_18760446) | (2972.778_4438.171) | (-0.248_0.153) | (5924316_8150802) | (1301.451_1790.565) | (-0.115_0.265) |
- | Both genders | Males | Changes (2010-2021) | Females | Changes (2010-2021) | ||||
DALY number | DALY rate per 100,000 | Changes (2010-2021) | DALY number | DALY rate per 100,000 | DALY number | DALY rate per 100,000 | |||
Europe | 8418281 | 3166.436 | -0.112 | 5976514 | 5097.047 | -0.184 | 2441767 | 1643.122 | 0.068 |
- | (7964899_8758645) | (2995.902_3294.46) | (-0.143_-0.084) | (5672625_6243635) | (4837.877_5324.861) | (-0.22_-0.152) | (2238368_2579953) | (1506.25_1736.11) | (0.032_0.103) |
WHO Regions | - | - | - | - | - | - | - | - | - |
African Region | 678416 | 814.413 | -0.043 | 480517 | 1235.253 | -0.050 | 197899 | 445.708 | 0.034 |
- | (602331_768340) | (723.075_922.363) | (-0.133_0.07) | (427493_551386) | (1098.945_1417.434) | (-0.149_0.073) | (166748_226701) | (375.55_510.576) | (-0.104_0.183) |
Eastern Mediterranean Region | 1048108 | 1407.974 | -0.037 | 838752 | 2171.564 | -0.056 | 209356 | 584.524 | 0.063 |
- | (920181_1208097) | (1236.124_1622.895) | (-0.16_0.107) | (725863_977752) | (1879.291_2531.442) | (-0.189_0.105) | (171894_251043) | (479.929_700.914) | (-0.126_0.255) |
European Region | 8586034 | 3085.755 | -0.120 | 6103222 | 4971.216 | -0.191 | 2482812 | 1596.908 | 0.057 |
- | (8131189_8934955) | (2922.287_3211.154) | (-0.15_-0.092) | (5798726_6374982) | (4723.197_5192.57) | (-0.226_-0.16) | (2276653_2623280) | (1464.31_1687.255) | (0.021_0.092) |
Region of the Americas | 5518481 | 2379.404 | -0.210 | 3130441 | 2928.981 | -0.245 | 2388040 | 1909.685 | -0.160 |
- | (5156140_5739149) | (2223.173_2474.549) | (-0.23_-0.19) | (2972652_3248259) | (2781.346_3039.217) | (-0.267_-0.224) | (2175171_2509784) | (1739.456_2007.042) | (-0.185_-0.138) |
South-East Asia Region | 3451022 | 1117.280 | 0.057 | 2404574 | 1616.713 | 0.032 | 1046448 | 653.439 | 0.137 |
- | (2949843_3877262) | (955.022_1255.277) | (-0.096_0.191) | (2076744_2731231) | (1396.297_1836.341) | (-0.143_0.185) | (834081_1239276) | (520.829_773.847) | (-0.017_0.298) |
Western Pacific Region | 18087358 | 3624.186 | -0.035 | 12400755 | 5190.725 | -0.070 | 5686603 | 2185.714 | 0.068 |
- | (14967716_21430920) | (2999.1_4294.14) | (-0.202_0.144) | (9580340_15453131) | (4010.152_6468.393) | (-0.279_0.188) | (4628024_6849611) | (1778.836_2632.73) | (-0.145_0.316) |
Health System Grouping Level | - | - | - | - | - | - | - | - | - |
Advanced Health System | 14400136 | 3049.014 | -0.140 | 9594310 | 4488.278 | -0.197 | 4805825 | 1858.944 | -0.030 |
- | (13500388_14917720) | (2858.506_3158.605) | (-0.159_-0.121) | (9133841_9942508) | (4272.867_4651.167) | (-0.22_-0.176) | (4327401_5059018) | (1673.884_1956.882) | (-0.055_-0.01) |
Basic Health System | 20273158 | 3059.385 | -0.050 | 13818091 | 4368.623 | -0.084 | 6455067 | 1863.733 | 0.047 |
- | (16921208_23603532) | (2553.549_3561.966) | (-0.203_0.111) | (10895294_16959756) | (3444.574_5361.868) | (-0.27_0.146) | (5389161_7623352) | (1555.98_2201.045) | (-0.143_0.261) |
Limited Health System | 2759867 | 836.847 | 0.047 | 1971760 | 1236.972 | 0.013 | 788107 | 462.528 | 0.187 |
- | (2476217_3086161) | (750.839_935.786) | (-0.104_0.183) | (1748041_2199335) | (1096.624_1379.74) | (-0.15_0.167) | (682644_908593) | (400.633_533.239) | (0.026_0.356) |
Minimal Health System | 158909 | 796.401 | 0.041 | 115584 | 1222.644 | 0.010 | 43325 | 412.627 | 0.113 |
- | (120507_220790) | (603.94_1106.529) | (-0.11_0.222) | (84839_170546) | (897.425_1804.026) | (-0.145_0.198) | (33108_54601) | (315.316_520.022) | (-0.101_0.395) |
- | Both genders | Males | Changes (2010-2021) | Females | Changes (2010-2021) | ||||
DALY number | DALY rate per 100,000 | Changes (2010-2021) | DALY number | DALY rate per 100,000 | DALY number | DALY rate per 100,000 | |||
GBD Region | - | - | - | - | - | - | - | - | - |
Central Europe, Eastern Europe, and Central Asia | 3436982 | 3024.001 | -0.116 | 2597087 | 5586.517 | -0.185 | 839896 | 1250.434 | 0.091 |
- | (3243146_3614237) | (2853.456_3179.957) | (-0.162_-0.072) | (2423068_2752545) | (5212.191_5920.919) | (-0.24_-0.138) | (780004_895430) | (1161.268_1333.113) | (0.029_0.156) |
Central Asia | 225236 | 1548.039 | -0.236 | 180539 | 2826.658 | -0.272 | 44697 | 547.577 | -0.129 |
- | (199859_249566) | (1373.625_1715.253) | (-0.315_-0.15) | (158975_200718) | (2489.04_3142.592) | (-0.351_-0.191) | (39419_50226) | (482.909_615.31) | (-0.235_-0.012) |
Central Europe | 1637723 | 4422.930 | -0.038 | 1137575 | 7029.726 | -0.125 | 500147 | 2399.289 | 0.205 |
- | (1519791_1740836) | (4104.436_4701.403) | (-0.105_0.022) | (1046989_1216922) | (6469.941_7520.053) | (-0.192_-0.062) | (458229_541753) | (2198.199_2598.876) | (0.112_0.29) |
Eastern Europe | 1574023 | 2535.517 | -0.135 | 1278973 | 5347.074 | -0.190 | 295051 | 773.196 | 0.027 |
- | (1421402_1713742) | (2289.666_2760.583) | (-0.215_-0.057) | (1140364_1411538) | (4767.586_5901.3) | (-0.278_-0.105) | (264892_325059) | (694.162_851.833) | (-0.072_0.133) |
High-income | 10617887 | 2984.879 | -0.153 | 6690445 | 4070.107 | -0.209 | 3927442 | 2052.573 | -0.058 |
Australasia | 221657 | 2509.066 | -0.106 | 129015 | 3070.831 | -0.146 | 92642 | 1999.635 | -0.047 |
- | (201708_240799) | (2283.253_2725.74) | (-0.173_-0.03) | (117303_141515) | (2792.057_3368.337) | (-0.229_-0.054) | (82235_100662) | (1775.02_2172.759) | (-0.108_0.018) |
High-income Asia Pacific | 1821752 | 2583.922 | -0.063 | 1328767 | 4106.494 | -0.093 | 492985 | 1292.376 | 0.002 |
- | (1605467_1950856) | (2277.149_2767.039) | (-0.11_-0.018) | (1215044_1403103) | (3755.04_4336.227) | (-0.135_-0.052) | (391676_555628) | (1026.791_1456.594) | (-0.069_0.065) |
High-income North America | 3702193 | 3289.836 | -0.226 | 2030321 | 3882.771 | -0.262 | 1671872 | 2775.178 | -0.183 |
- | (3456812_3866920) | (3071.786_3436.215) | (-0.246_-0.207) | (1925297_2109910) | (3681.924_4034.977) | (-0.288_-0.239) | (1509181_1764424) | (2505.124_2928.807) | (-0.206_-0.16) |
Southern Latin America | 333680 | 2267.447 | -0.188 | 221030 | 3359.792 | -0.257 | 112649 | 1384.341 | -0.019 |
- | (307219_363305) | (2087.64_2468.757) | (-0.251_-0.111) | (203004_239645) | (3085.782_3642.747) | (-0.323_-0.187) | (101207_124359) | (1243.72_1528.239) | (-0.107_0.09) |
Western Europe | 4538605 | 3043.297 | -0.132 | 2981312 | 4323.758 | -0.213 | 1557293 | 1942.183 | 0.044 |
- | (4219045_4755438) | (2829.021_3188.691) | (-0.163_-0.102) | (2802822_3113953) | (4064.897_4516.126) | (-0.246_-0.183) | (1397833_1659560) | (1743.313_2069.725) | (0.005_0.079) |
Latin America and Caribbean | 1503628 | 1415.459 | -0.090 | 892265 | 1831.834 | -0.146 | 611363 | 1062.868 | 0.017 |
- | (1385991_1618090) | (1304.72_1523.209) | (-0.144_-0.036) | (826670_958313) | (1697.165_1967.432) | (-0.202_-0.085) | (554373_662268) | (963.789_1151.367) | (-0.048_0.088) |
Andean Latin America | 109922 | 1109.598 | -0.044 | 60516 | 1278.403 | -0.068 | 49406 | 955.119 | -0.007 |
- | (84946_135856) | (857.485_1371.387) | (-0.243_0.168) | (47086_75150) | (994.704_1587.544) | (-0.265_0.166) | (36647_61666) | (708.459_1192.127) | (-0.228_0.244) |
Caribbean | 201540 | 2176.819 | -0.070 | 129853 | 2985.910 | -0.090 | 71687 | 1460.135 | -0.020 |
- | (178389_227376) | (1926.765_2455.877) | (-0.184_0.033) | (113689_146980) | (2614.218_3379.728) | (-0.209_0.018) | (61848_81914) | (1259.747_1668.454) | (-0.136_0.104) |
Central Latin America | 447580 | 1046.574 | -0.132 | 268449 | 1365.641 | -0.164 | 179131 | 775.161 | -0.063 |
- | (394104_508099) | (921.53_1188.086) | (-0.227_-0.023) | (233134_306854) | (1185.987_1561.012) | (-0.272_-0.049) | (153638_207069) | (664.847_896.062) | (-0.182_0.062) |
- | Both genders | Males | Changes (2010-2021) | Females | Changes (2010-2021) | ||||
DALY number | DALY rate per 100,000 | Changes (2010-2021) | DALY number | DALY rate per 100,000 | DALY number | DALY rate per 100,000 | |||
Tropical Latin America | 744586 | 1680.864 | -0.063 | 433447 | 2170.609 | -0.150 | 311140 | 1278.887 | 0.100 |
- | (699950_783162) | (1580.098_1767.946) | (-0.103_-0.021) | (407199_457307) | (2039.167_2290.098) | (-0.194_-0.101) | (284939_330791) | (1171.193_1359.659) | (0.045_0.153) |
North Africa and Middle East | 1425166 | 1869.467 | -0.057 | 1164707 | 3018.571 | -0.082 | 260458 | 691.805 | 0.056 |
- | (1235874_1644515) | (1621.163_2157.199) | (-0.185_0.096) | (998361_1367526) | (2587.452_3544.217) | (-0.215_0.083) | (218063_303375) | (579.198_805.797) | (-0.131_0.258) |
North Africa and Middle East | 1425166 | 1869.467 | -0.057 | 1164707 | 3018.571 | -0.082 | 260458 | 691.805 | 0.056 |
- | (1235874_1644515) | (1621.163_2157.199) | (-0.185_0.096) | (998361_1367526) | (2587.452_3544.217) | (-0.215_0.083) | (218063_303375) | (579.198_805.797) | (-0.131_0.258) |
South Asia | 1887377 | 760.135 | 0.103 | 1375271 | 1130.202 | 0.044 | 512106 | 404.471 | 0.343 |
- | (1585172_2154999) | (638.423_867.919) | (-0.095_0.291) | (1114965_1585848) | (916.281_1303.254) | (-0.168_0.248) | (432833_600824) | (341.86_474.542) | (0.092_0.623) |
South Asia | 1887377 | 760.135 | 0.103 | 1375271 | 1130.202 | 0.044 | 512106 | 404.471 | 0.343 |
- | (1585172_2154999) | (638.423_867.919) | (-0.095_0.291) | (1114965_1585848) | (916.281_1303.254) | (-0.168_0.248) | (432833_600824) | (341.86_474.542) | (0.092_0.623) |
Southeast Asia, East Asia, and Oceania | 18124029 | 3568.357 | -0.044 | 12361382 | 5075.046 | -0.075 | 5762647 | 2180.031 | 0.047 |
- | (14918989_21439691) | (2937.331_4221.162) | (-0.216_0.137) | (9504105_15443049) | (3901.972_6340.244) | (-0.285_0.188) | (4712955_6910714) | (1782.929_2614.349) | (-0.165_0.293) |
East Asia | 15502899 | 3953.603 | -0.044 | 10532324 | 5552.328 | -0.076 | 4970575 | 2455.468 | 0.056 |
- | (12467252_18831949) | (3179.441_4802.588) | (-0.236_0.166) | (7844220_13557156) | (4135.239_7146.929) | (-0.318_0.224) | (3937268_6141452) | (1945.014_3033.883) | (-0.184_0.342) |
Oceania | 23751 | 1924.455 | 0.045 | 17139 | 2651.737 | 0.032 | 6612 | 1124.782 | 0.093 |
- | (17906_33090) | (1450.868_2681.206) | (-0.146_0.283) | (12523_24470) | (1937.553_3785.944) | (-0.171_0.279) | (4797_9362) | (816.098_1592.629) | (-0.122_0.355) |
Southeast Asia | 2597379 | 2267.371 | -0.014 | 1811918 | 3403.722 | -0.030 | 785460 | 1280.895 | 0.015 |
- | (2133351_3004461) | (1862.299_2622.731) | (-0.154_0.123) | (1498353_2137437) | (2814.684_4015.215) | (-0.185_0.128) | (604070_944581) | (985.091_1540.382) | (-0.138_0.182) |
Sub-Saharan Africa | 637916 | 818.476 | -0.039 | 446707 | 1237.409 | -0.044 | 191209 | 457.008 | 0.038 |
- | (565855_727509) | (726.018_933.427) | (-0.131_0.077) | (394235_516681) | (1092.057_1431.243) | (-0.147_0.08) | (161649_219338) | (386.357_524.238) | (-0.102_0.191) |
Central Sub-Saharan Africa | 97294 | 1078.229 | 0.099 | 71677 | 1738.744 | 0.056 | 25617 | 522.673 | 0.160 |
- | (68062_145954) | (754.272_1617.479) | (-0.138_0.408) | (47308_115842) | (1147.591_2810.089) | (-0.19_0.342) | (18512_34459) | (377.711_703.078) | (-0.155_0.559) |
Eastern Sub-Saharan Africa | 188817 | 698.349 | 0.003 | 131554 | 1021.454 | -0.036 | 57263 | 404.440 | 0.138 |
- | (163819_225570) | (605.894_834.283) | (-0.151_0.167) | (111725_159739) | (867.491_1240.292) | (-0.212_0.143) | (44794_69457) | (316.378_490.569) | (-0.07_0.376) |
Southern Sub-Saharan Africa | 206656 | 2122.752 | -0.116 | 136927 | 3388.552 | -0.158 | 69729 | 1224.518 | -0.015 |
- | (187456_229595) | (1925.536_2358.384) | (-0.2_-0.016) | (121076_154957) | (2996.291_3834.761) | (-0.254_-0.043) | (61196_79052) | (1074.656_1388.228) | (-0.137_0.121) |
Western Sub-Saharan Africa | 145149 | 451.571 | 0.000 | 106549 | 707.597 | 0.029 | 38600 | 225.926 | 0.096 |
- | (120032_174006) | (373.428_541.349) | (-0.126_0.165) | (88698_128227) | (589.046_851.563) | (-0.12_0.222) | (29706_46355) | (173.866_271.317) | (-0.097_0.316) |
SDI: Socio-demographic Index, TBLC: tracheal, bronchus, and lung cancer, WHO: World Health Organization, GBD: Global Burden of Disease
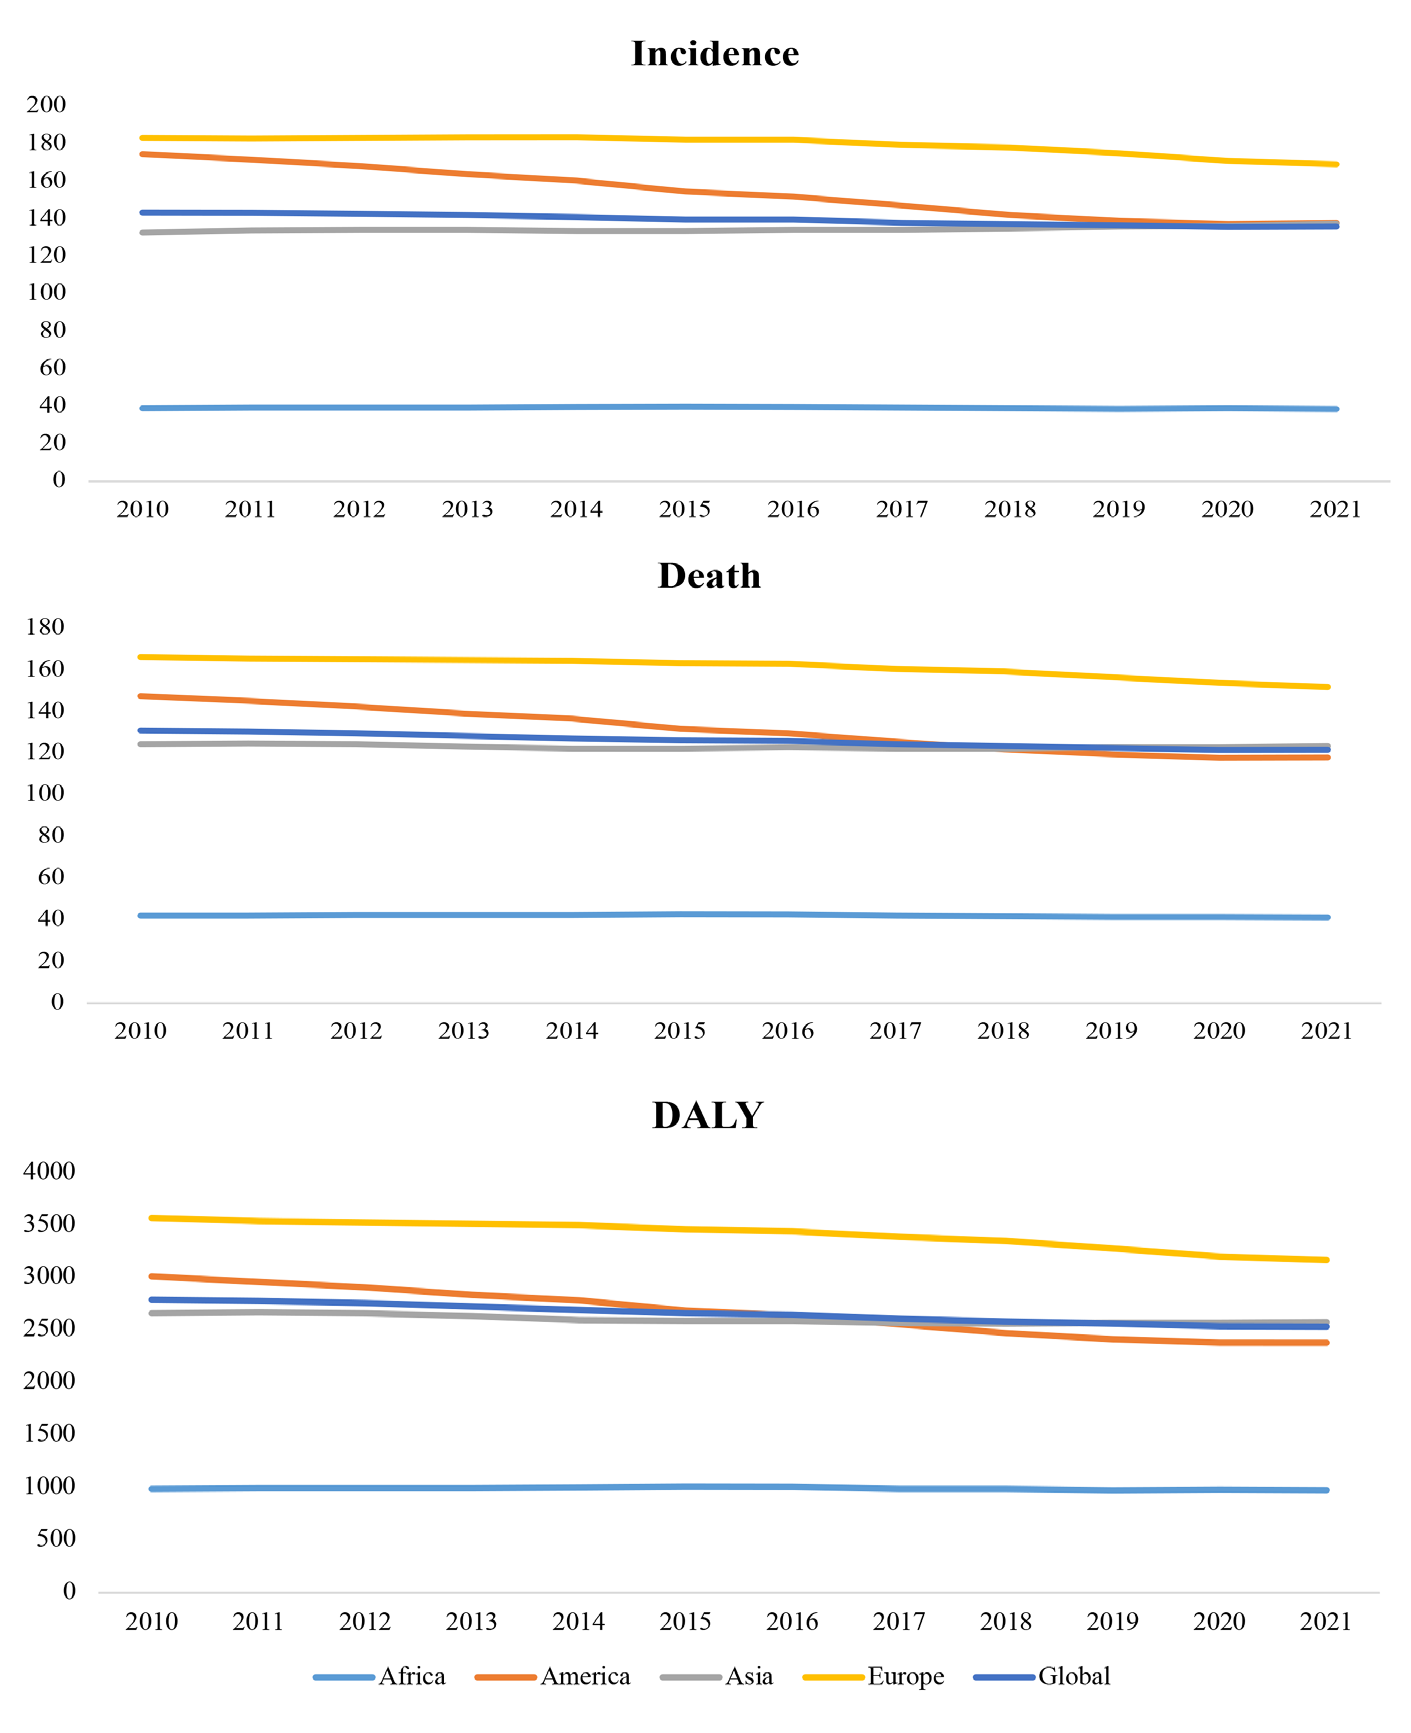
TBLC: tracheal, bronchus, and lung cancer
The Global Trend of TBLC Among Aged ≥55 Years by Continents
In 2021, approximately 60% of TBLC incidence, death, and DALY cases were recognized in Asian countries, but more TBLC incidence, death, and DALY rates were reported in European countries, with 169.159, 151.834, and 3,166.436 cases per 100,000 population, respectively. While between 2010 and 2021, the TBLC incidence rate (per 100,000) increased by 3.6% in Asia, other continents reported a downward trend of up to 20.9% (America). Males on all continents experienced a decreasing trend in the observed factor, but among women, only America reported a downward trend (17.3%). At this time, the TBLC death and DALY rates (per 100,000) in all continents decreased; the highest decrease was reported in America by 20 and 21%, respectively. Also, males in all continents reported a decreasing trend, but for women, only America experienced a downward trend of 15.9% (, , and, ).
The Global Trend of TBLC Among Aged ≥55 Years by Socio-demographic Index
In 2021, most TBLC incidence cases (34.4%) were recorded in high SDI countries. High-middle SDI countries exhibited the highest TBLC deaths (32.2%) and DALYs (32.9%). High SDI countries experienced the highest decreasing trend in TBLC incidence, death, and DALY rates (per 100,000) by a 10.9, 11.2, and 15.1% decrease, respectively, compared to 2010. TBLC incidence rate for males decreased in high and high-middle SDI countries from 2010 to 2021, while only high SDI countries recorded a decreasing trend for females. TBLC death and DALY rates for males increased in low and low-middle SDI countries from 2010 to 2021, while only for females high SDI countries recorded a slight decreasing trend in TBLC death and DALY rates by 3% and 6.1%, respectively (, , and, ).
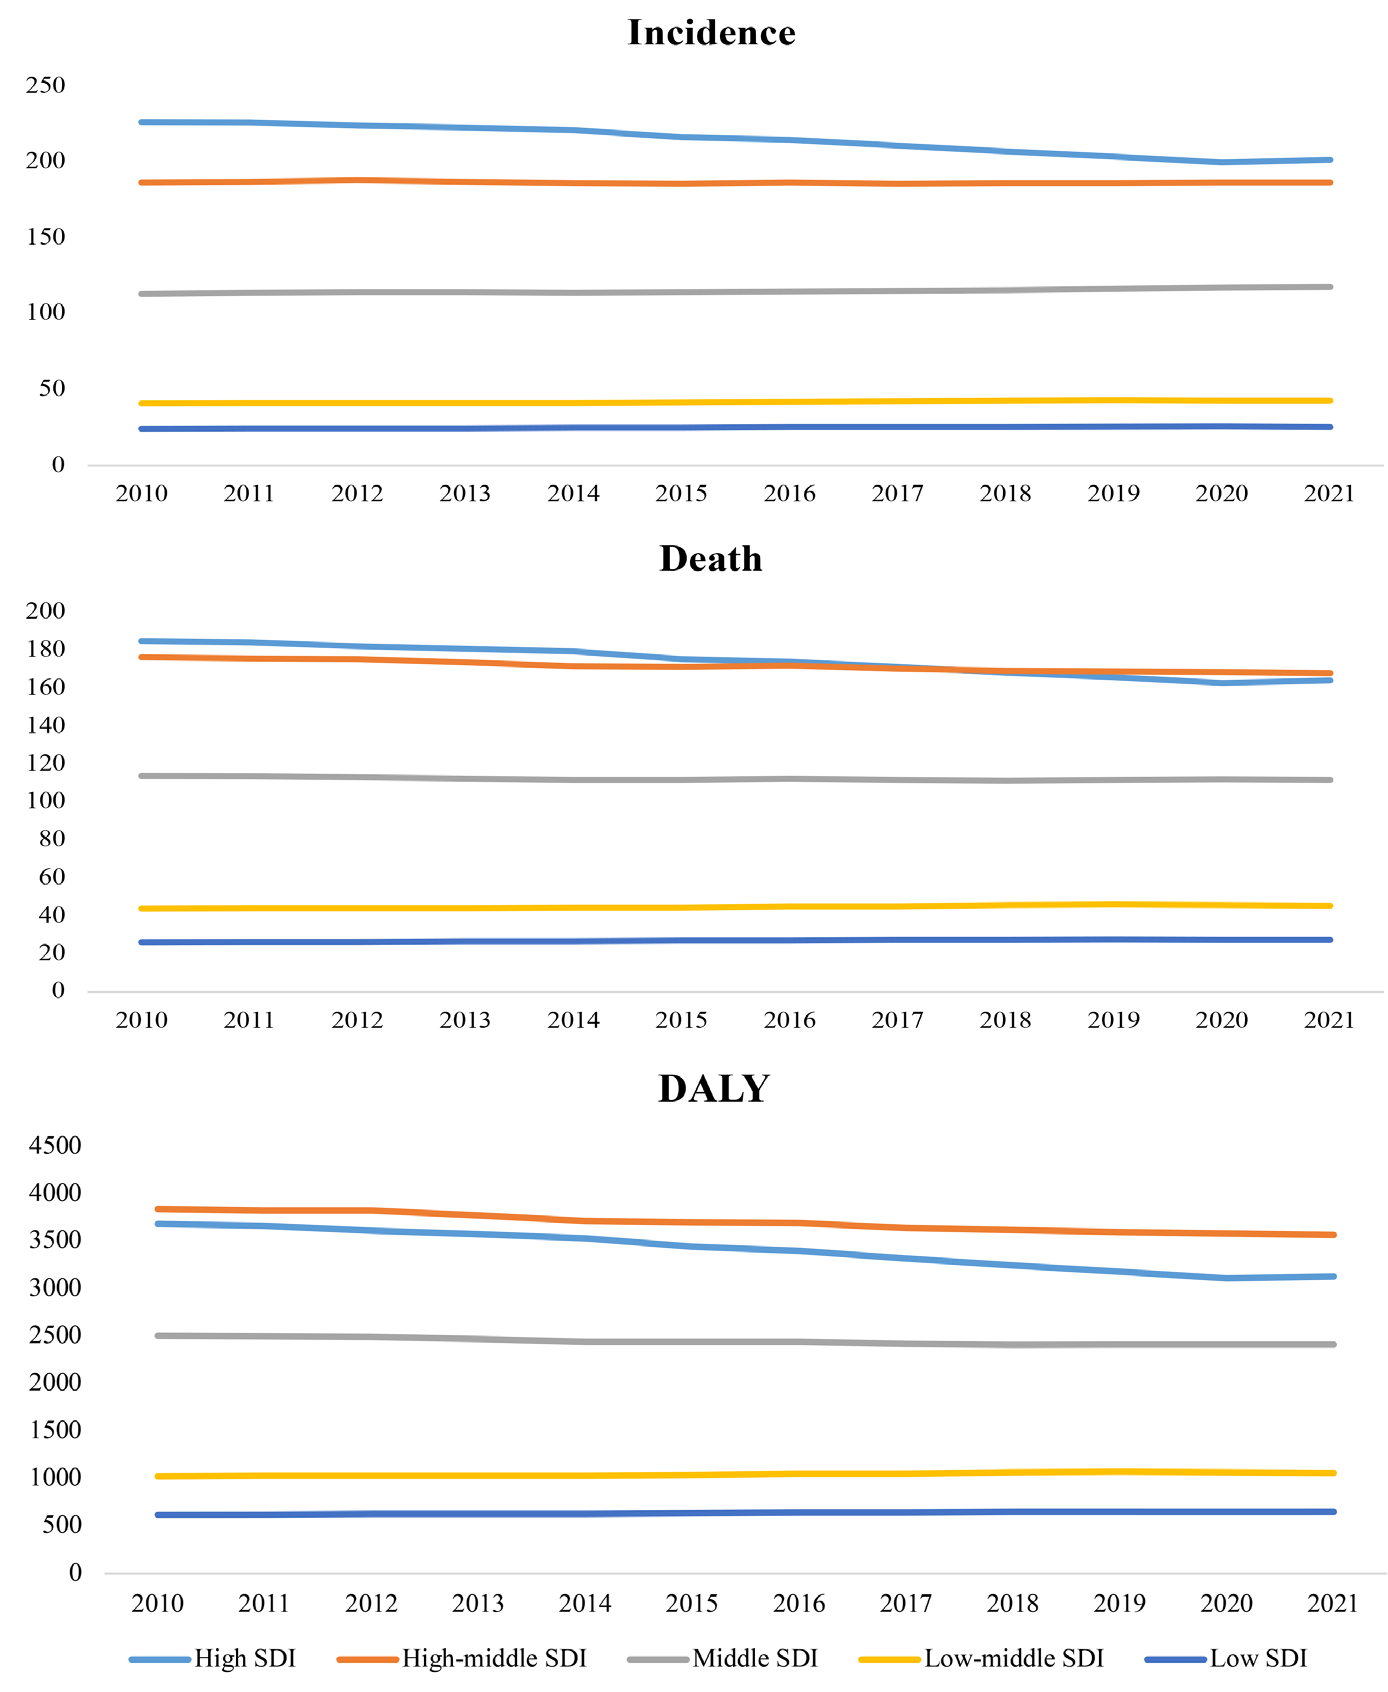
SDI: socio-demographic index, TBLC: tracheal, bronchus, and lung cancer
The Global Trend of TBLC Among Aged ≥55 Years by World Bank Income Levels
In 2021, the highest TBLC incidence, death, and DALYs rates (per 100,000) were reported in World Bank high-income countries with an incidence rate of 193.124, high-income countries with a death rate of 162.533, and upper middle-income countries with DALYs of 3,218.568, respectively. World Bank high-income countries experienced the highest downward trends of 10.7, 11.1, and 15.0% in incidence, death, and DALYs rates (per 100,000) between 2010 and 2021, respectively. The male TBLC incidence rate (per 100,000) decreased in all World Bank groups except World Bank lower middle-income, which reported a stable trend. The male TBLC death and DALY rates (per 100,000) decreased in all World Bank groups, up to 16.9% and 20.9%, in the World Bank high-income group, respectively. The TBLC incidence rate for females increased up to 16.8% in the World Bank upper middle-income countries. The TBLC death and DALY rates for females increased by 13.9% and 15.4%, respectively, in countries classified by the World Bank as lower middle-income (, , ).
The Global Trend of TBLC Among Aged ≥55 years in WHO Regions
In 2021, the Western Pacific Region exhibited the highest incidence rate of TBLC for both genders. The region of the Americas experienced a downward trend of 10.7%, 23.7%, and 17.3% for both genders, males, and females in the TBLC incidence rate compared to 2010. The Western Pacific region exhibited the highest death rate of TBLC for both genders. The Region of the Americas experienced a downward trend in TBLC death rates of 20% for both genders, 23.1% for males, and 15.9% for females compared to 2010. The Western Pacific Region exhibited the highest DALY rate of TBLC for both genders. The region of the Americas experienced a downward trend of 21%, 24.5%, and 16% for both genders combined, males, and females, TBLC DALY rate compared to 2010. Female TBLC incidence, death, and DALY rates, in all WHO regions increased, except the region of the Americas (, , and, ).
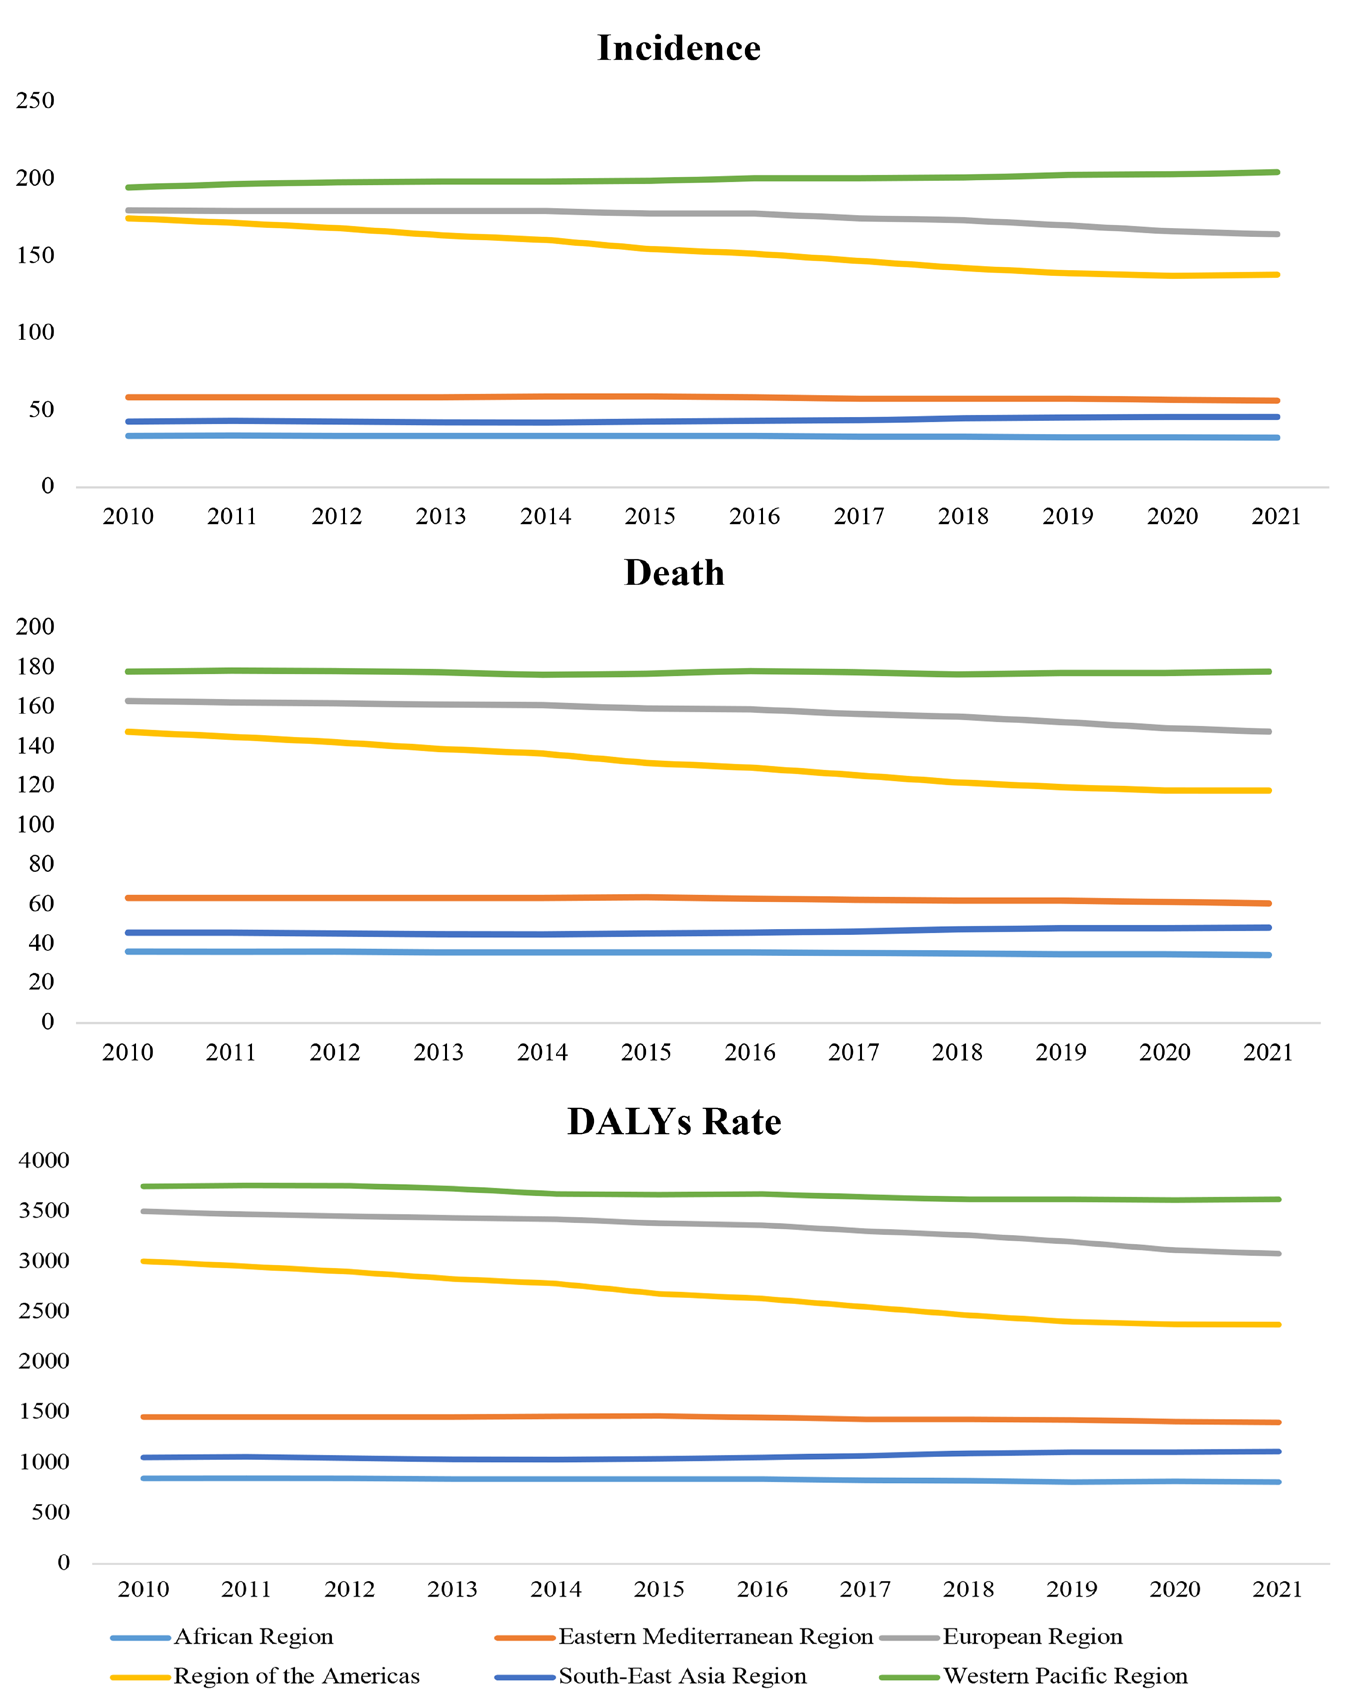
TBLC: tracheal, bronchus, and lung cancer, WHO: World Health Organization
The Global Trend of TBLC Among Aged ≥55 Years by Health System Advancement Levels
Countries with Advanced Health Systems reported the highest TBLC incidence, death, and DALY rates with 183.297, 154.404, and 3,059.385 per 100,000 people, respectively, and the highest decreasing trend of 10.3, 10.6, and 14% compared to 2010 for these indicators. In contrast, the most notable increasing trend in TBLC incidence, death, and DALY rates is observed in females living in countries with Limited Health Systems, experiencing respective increases of 19.4%, 18.2%, and 18.7% ().
The Global Trend of TBLC Among Aged ≥55 Years in GBG Regions
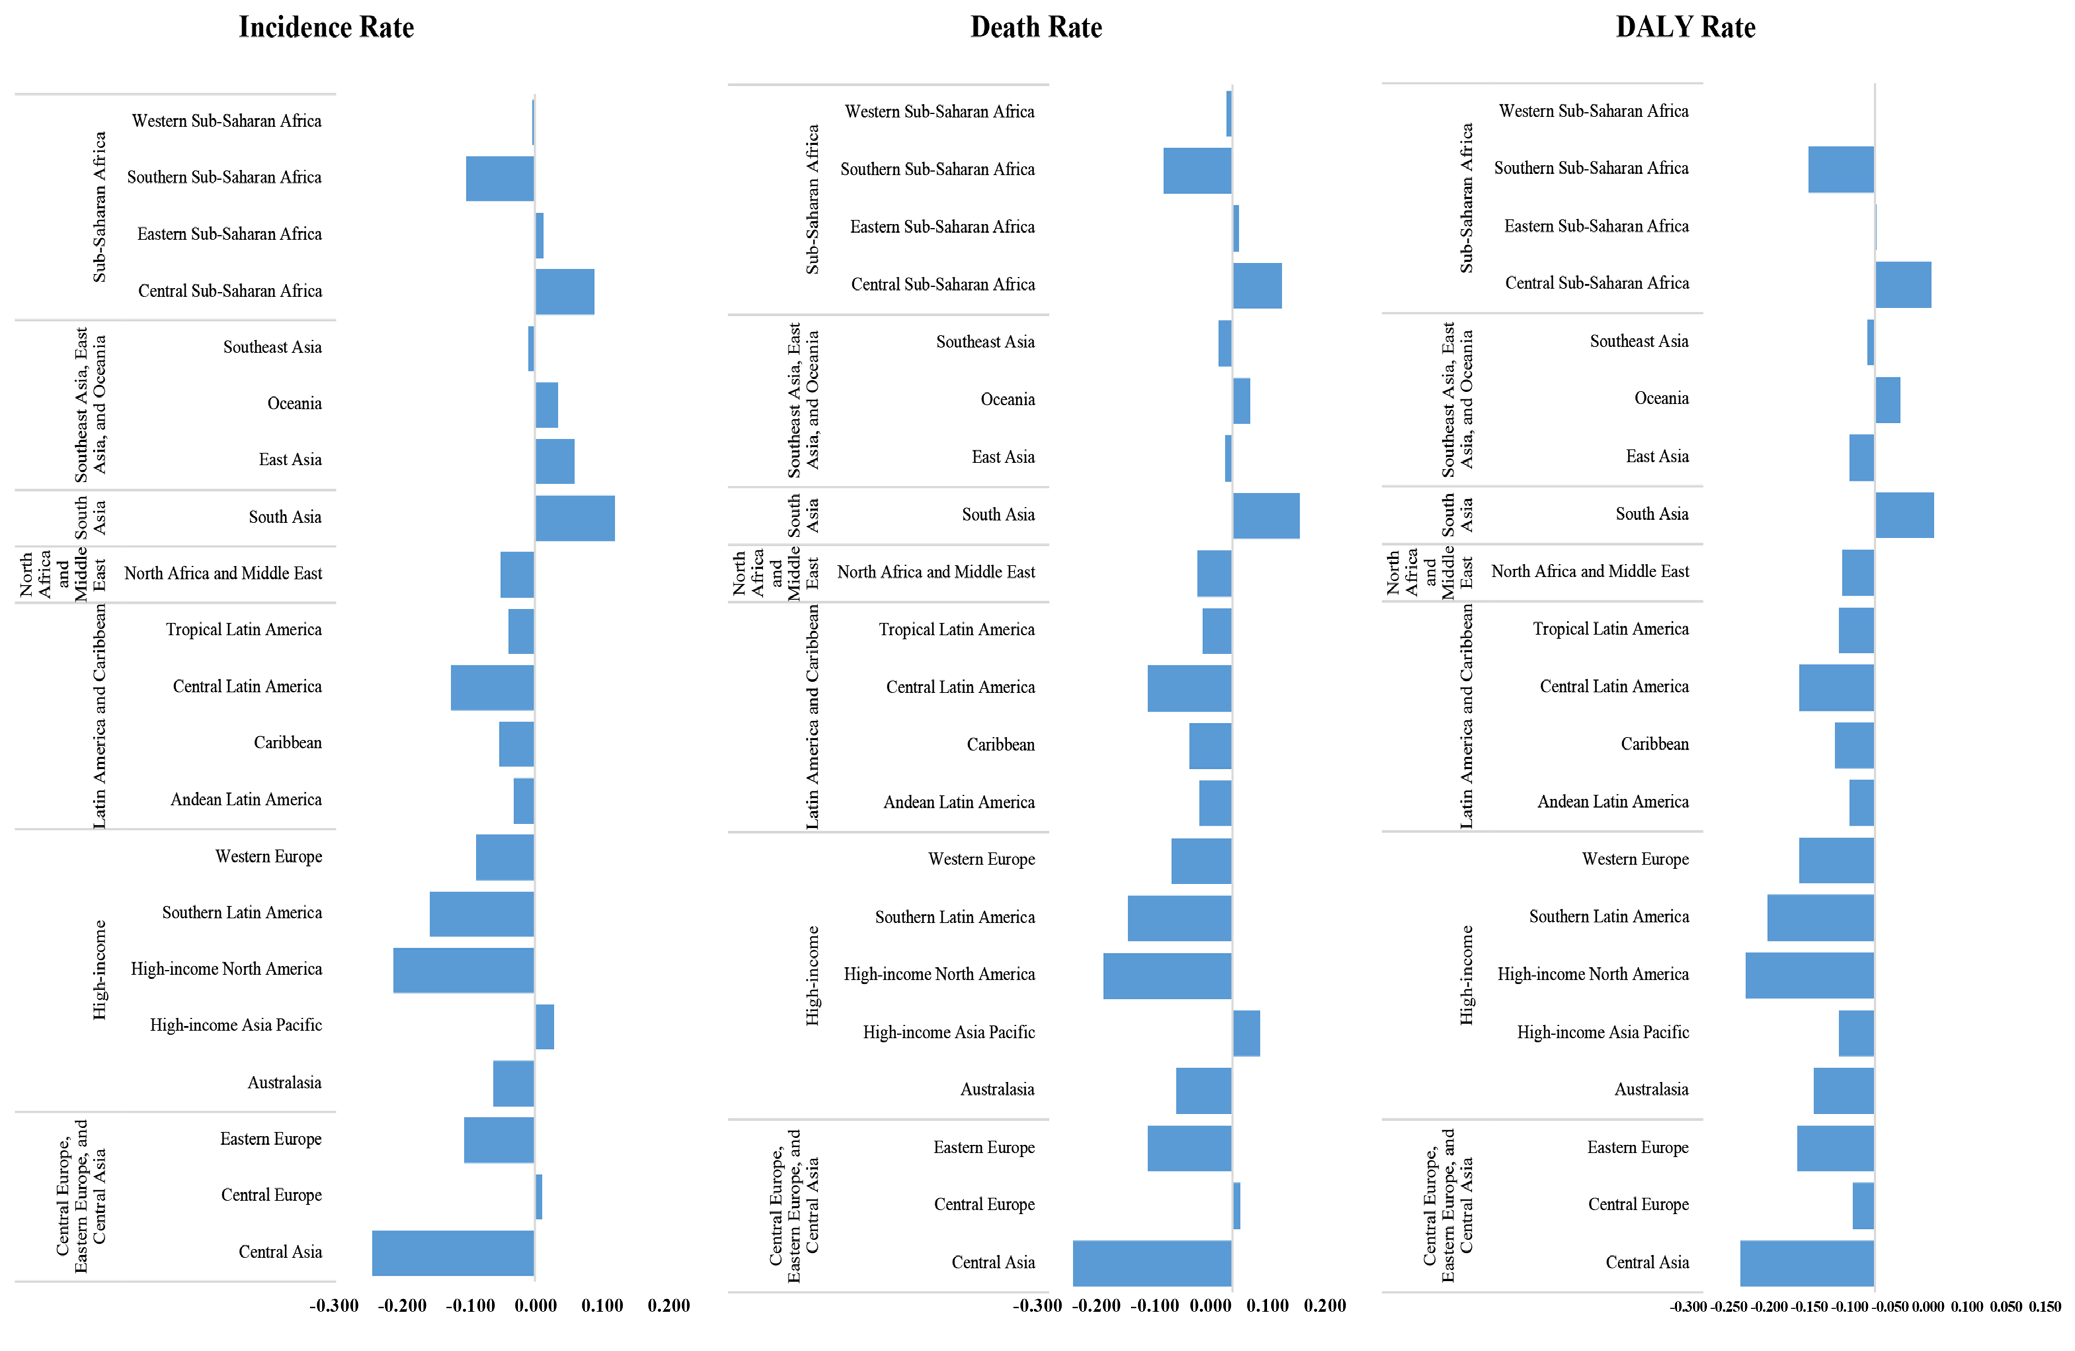
In 2021, among GBG regions, the highest TBLC incidence rate (per 100,000) was allocated to East Asia with 213.477. Between 2010 and 2019, 15, 18, and 6 regions of GBD regions reported a downward trend in TBLC incidence number and rate (per 100,000) for both genders, males, and females, respectively. The highest increase was observed in South Asia (12%), Western Europe (6%), and Central Latin America and the high-income Asia Pacific (35.7%) for both genders, males, and females, respectively. The highest decrease was observed in Central Asia (24.5%), East Asia (27.5%), and North Africa and Middle East and North America (17.8%) for both genders, males, and females, respectively (, , ).
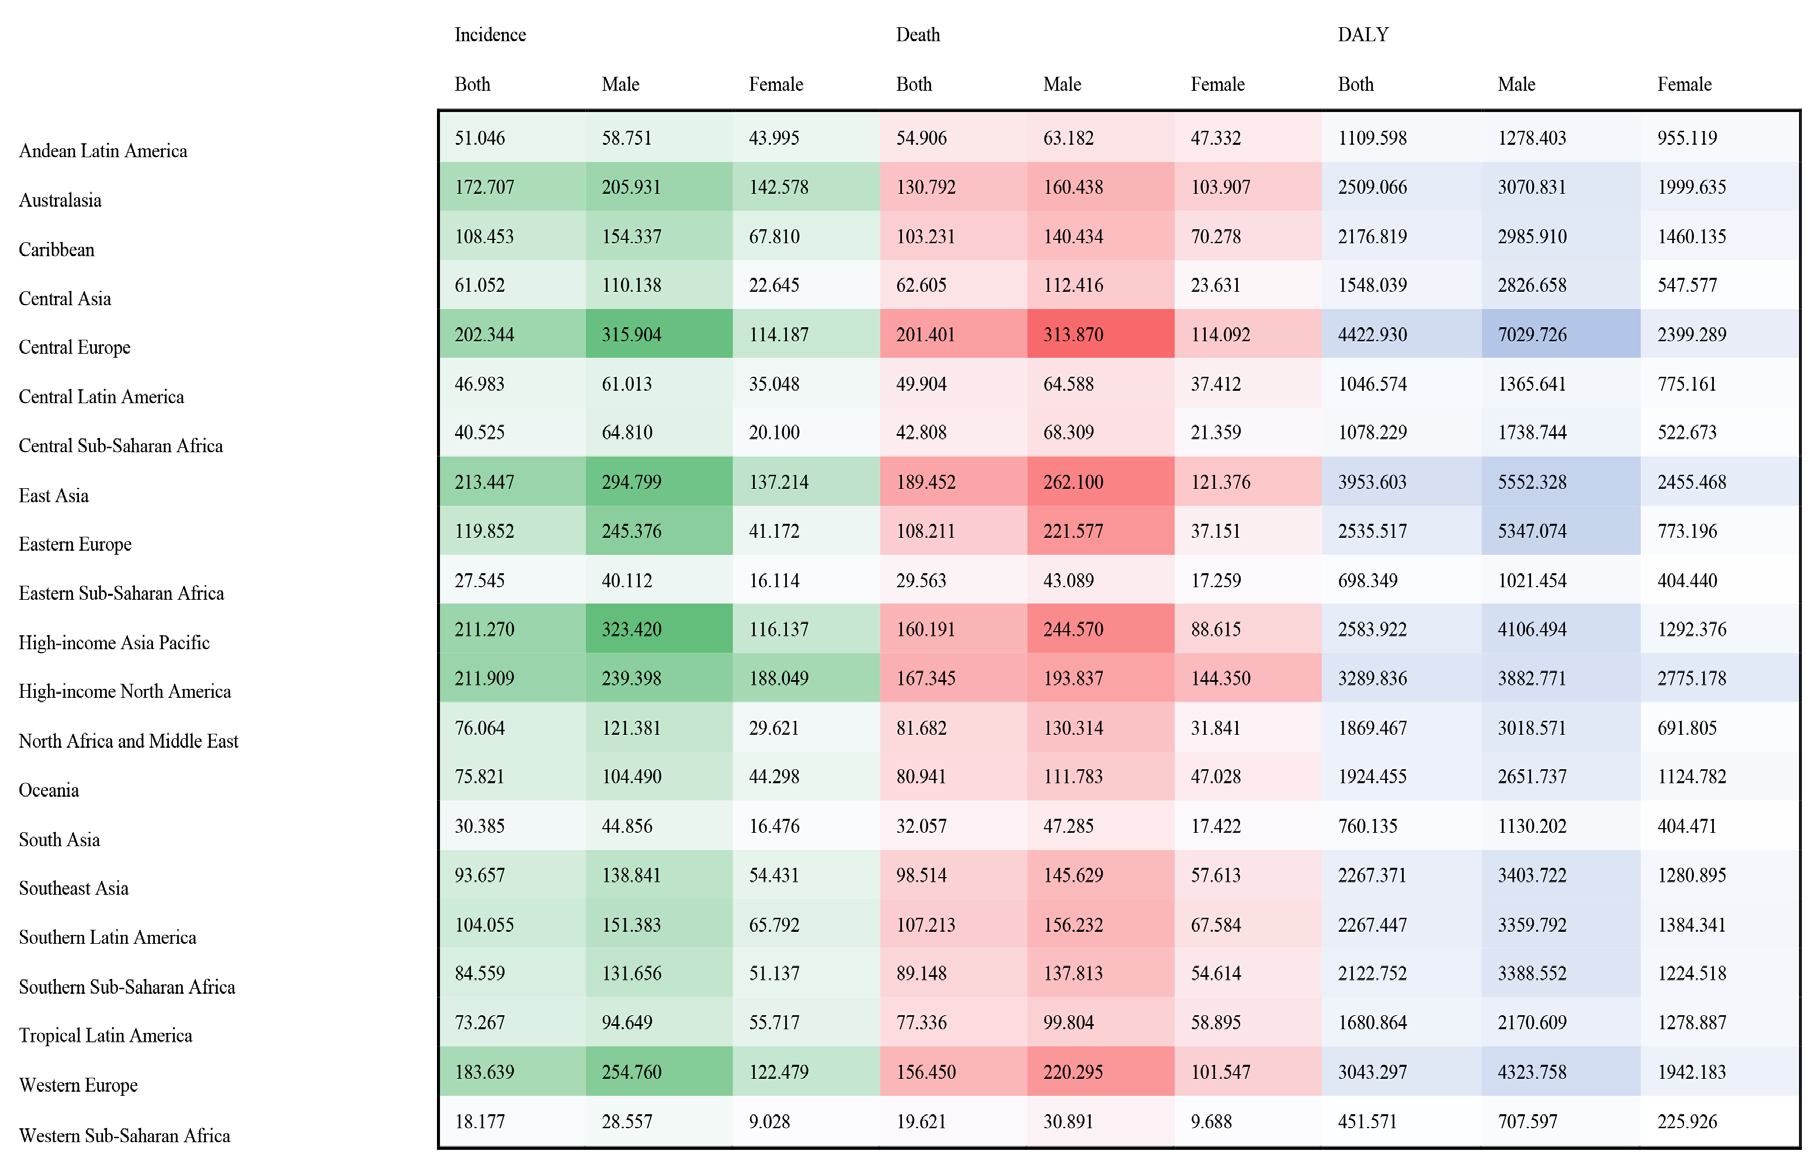
TBLC: tracheal, bronchus, and lung cancer, GBD: Global Burden of Disease
TBLC: tracheal, bronchus, and lung cancer, GBD: Global Burden of Disease
The highest TBLC death rate (per 100,000) was recorded in Central Europe (201.401). Between 2010 and 2019, 16, 17, and 9 GBD regions reported a downward trend in TBLC death number and rate (per 100,000) for both genders, males, and females, respectively. The highest increase was observed in South Asia, with increases of 11.1%, 5.2%, and 34.2% for both genders, males, and females, respectively. The highest decrease was observed in Central Asia with a 26.1%, 29.4%, and 17.6% decrease for both genders, males, and females, respectively (, and, , ).
The highest TBLC DALY rate (per 100,000) was recorded in Central Europe (4,422.930). Between 2010 and 2019, 17 GBD regions, 17 for males, and 9 for females reported a downward trend in TBLC DALY number and rate (per 100,000) for both genders, males, and females, respectively. The highest increase was observed in South Asia (10.3%), Central Sub-Saharan Africa (5.6%), and a third region with an increase of 34.3%, for both genders combined, and separately for males and females, respectively. The highest decrease was observed in Central Asia (23.6%), Central Asia (27.2%), and High-income North America (18.3%) decrease for both genders, males, and females, respectively (, , ).
National Comparison of the Global Trend of TBLC Among Aged ≥55 Years
In 2021, Monaco, with 414.333, 540.472, and 301.309, exhibited the highest TBLC incidence rates (per 100,000) for both genders, males, and females, respectively. Between 2010 and 2019, 64; 48; and 130 out of 204 countries and territories experienced an increasing trend in TBLC incidence rates (per 100,000) for both genders, males, and females, respectively. The highest increase was observed in Cabo Verde (27.9%) and Bulgaria (43.7%) for both genders, males, and females, respectively. In contrast, the highest decrease was observed in the United Arab Emirates (53.4%) and Kuwait (45.1%) for both genders.
Also, Monaco exhibited the highest TBLC death rates (per 100,000) of 370.074 for both genders, 488.984 for males, and 263.527 for females, respectively. Between 2010 and 2019, 58 43 and 120 out of 204 countries and territories experienced an increasing trend in TBLC death rates (per 100,000) for both genders, males, and females, respectively. The highest increase was observed in Cabo Verde (23.6% for both genders, 28.8% for males), and Bulgaria (45.0% for females). In contrast, the highest decrease was observed in the United Arab Emirates (53.8%), Saudi Arabia (58.7%), and Kuwait (46.4%) for both genders, males, and females, respectively.
Also, Monaco (7,091.097), Monaco (9,522.039), and Greenland (5,583.999) exhibited the highest TBLC DALY rates (per 100,000) for both genders, males, and females, respectively. Between 2010 and 2019, 62, 45, and 125 out of 204 countries and territories experienced an increasing trend in TBLC DALY rates (per 100,000) for both genders, males, and females, respectively. The highest increase was observed in Cabo Verde (36.8%), Cabo Verde (45.2%), and Bulgaria (43.6%) for both genders, males, and females, respectively. In contrast, the highest decrease was observed in the United Arab Emirates (54.1%), United Arab Emirates (58.1%), and Kuwait (46.1%) for both genders, males, and females, respectively.
DISCUSSION
The results of the present study showed that global TBLC incidence, mortality, and DALYs decreased in adults ≥55 years from 2010 to 2021. In 2021, more than 66% of new TBLC cases occurred in men, and the incidence rate declined by 9.6% in men. Contrarily, females experienced a 3.8% increase from 2010. While males account for the majority of TBLC burden, it is important to pay attention to the higher growth rate of women and the associated risk factors.
TBLC mortality is generally increasing among patients aged 70 and older, and, due to the growing geriatric population, managing TBLC in this population is becoming a greater concern.Older patients often have reduced functional reserves and limited ability to receive proper treatments. Moreover, a higher prevalence of underlying diseases results in unfavorable treatment outcomes.
The burden of TBLC is primarily influenced by smoking in both men and women. East Asia, Western Europe, and high-income North America bear a higher TBLC burden due to historical smoking patterns. TBLC mortality typically peaks 30-40 years after the peak smoking prevalence in a population. Therefore, implementing effective approaches to reduce smoking could help reduce the burden of the disease, particularly in low SDI populations. In East Asia, where female smoking rates are low, indoor air pollution from cooking and heating emerges as a major factor in TBLC incidence. This study confirms distinct gender variations in the global burden of TBLC due to occupational carcinogens, aligning with previous studies. Additionally, female TBLC rates increased in World Bank middle-income countries, where smoking among women is steadily rising because it is becoming normalized due to social media, globalization, and marketing efforts. The gender gap could be attributed to variations in smoking rates and biological responses to tobacco between men and women. Exposure to sex hormones and molecular characteristics could heighten women’s vulnerability to TBLC.
Air pollution, occupational exposures, second-hand smoking, low fruit intake, and elevated fasting plasma glucose levels are known to contribute to death and DALYs from TBLC. High fasting plasma glucose is an important risk factor among older men in developed countries. Therefore, TBLC screening should be included in routine diabetes assessments.
In 2021, approximately 60% of TBLC cases occurred in Asian countries, while European countries exhibited the highest TBLC incidence rate. In contrast with the global decreasing trend, the TBLC incidence, death, and DALY rates in Asia increased. Rezaei et al.’s study showed a decrease in the age-standardized incidence rate of TBLC in Asia, but our study, which considered a cutoff of ≥55 years and a longer period, found an increase in the TBLC incidence. The high geographical variation observed in the epidemiological rates and trends of TBLC in this study highlights the need for tailored global disease burden control strategies, taking into account the discrepancies in healthcare resources and opportunities for diagnosis and treatment.
There are uneven burdens across the five SDI quintiles, reflecting inequalities in healthcare access. Our study found that TBLC DALY and death rates for males increased in low and low-middle SDI countries, while high and high-middle SDI countries saw a decrease in TBLC DALY and death rates. For females, only high SDI countries showed a decreasing trend in incidence rates. The high death and DALY rates in high-middle SDI countries reflected industrialization and cumulative occupational exposures from decades ago. Previous studies have estimated a 20-fold variation in TBLC incidence rates by region, largely reflecting the maturity of the tobacco epidemic and historical patterns of tobacco exposure, including intensity, duration, cigarette types, and degree of inhalation. Currently, 80% of the world’s smokers live in low- and middle-income countries. In low-middle and low SDI quintiles, the top risk factors for TBLC deaths and DALYs include air pollution, tobacco, and dietary risks. Occupational exposure to silica was the primary risk factor for TBLC in individuals aged 20-39 and 40-59, whereas asbestos exposure was the primary risk for those aged 60-79 and over 80. This difference is likely due to the latency period between exposure and TBLC morbidity. Therefore, occupational asbestos exposure remains a significant risk factor in high SDI countries.
On the other hand, late diagnosis results in poor prognosis for patients. The failure to implement and manage appropriate screening programs in governments and health systems, along with the failure to establish primary prevention laws, leads to increasing trends in all TBLC indicators, especially in women. The American Cancer Society recommends annual low-dose helical computed tomography for TBLC screening in older adults. Effective screening programs can significantly reduce TBLC incidence and mortality. However, differences in equipment, resources, and personnel skills affect early detection rates. Generally, given that TBLC is largely preventable, effective management and intervention by healthcare systems is essential. Moreover, prioritizing early diagnosis is crucial for improving TBLC prognosis. These findings highlight the need for adaptable control strategies tailored to local conditions to mitigate the global burden of this disease.
Interpretation of the results of this study should be interpreted with caution because using online data presents limitations, such as potential errors in stored data, delays in data access, changes in coding practices over time, and reliability gaps in cancer reporting and registries, particularly low-SDI countries.
CONCLUSION
The global burden of TBLC is predominantly in Asian countries (mainly East Asia), with a slower decrease in incidence, death, DALY, and burden rates compared to other regions. Therefore, measures are recommended to reduce the progression of TBLC, such as reducing exposure to risk factors, expanding screening and diagnostic programs, especially for high-risk male smokers, and improving treatment procedures. In addition, more research are needed to investigate the causes of the increasing trend of TBLC in women. controlling related risk factors in women needs urgent and effective preventive interventions.
Footnotes
Ethics
Ethics Committee Approval: The Jahrom University of Medical Sciences Ethical Research Committee approved this study (approval no: IR.JUMS.REC.1401.094, date: 23.11.2022).
Informed Consent: Because utilizing anonymous online datasets, informed consent was not required.
Authorship Contributions
Concept: H.S., A.M., F.R., Data Collection or Processing: A.M., E.S., Z.S., Analysis or Interpretation: H.S., F.S.-S., A.M., Literature Search: A.M., E.S., F.R., F.S.-S., Z.S., L.A., H.S., Writing: A.M., E.S., F.R., F.S.-S., Z.S., L.A., H.S.
Conflict of Interest: No conflict of interest was declared by the authors.
Financial Disclosure: The authors declared that this study received no financial support.
References
GBD 2019 Respiratory Tract Cancers Collaborators. Global, regional, and national burden of respiratory tract cancers and associated risk factors from 1990 to 2019: a systematic analysis for the Global Burden of Disease Study 2019.Lancet Respir Med. 2021;9(9):1030-1049.
Zhang J, Tang J, Yang R, Chen S, Jian H, Zeng PJAoGH. The global, regional, and national burden of tracheal, bronchus, and lung cancer caused by smoking: an analysis based on the global burden of disease study 2021.Annals of Global Health. 2024;90(1):1-15.
Zuo JJ, Tao ZZ, Chen C, et al. Characteristics of cigarette smoking without alcohol consumption and laryngeal cancer: overall and time-risk relation. A meta-analysis of observational studies.Eur Arch Otorhinolaryngol. 2017;274(39):1617-1631.
Rezaei F, Mazidimoradi A, Rayatinejad A, Allahqoli L, Salehiniya H. Temporal trends of tracheal, bronchus, and lung cancer between 2010 and 2019, in Asian countries by geographical region and sociodemographic index, comparison with global data.Thorac Cancer. 2023;14(18):1668-1706.
Levit L, Balogh E, Nass S, Ganz PA. Committee on Improving the Quality of Cancer Care: Addressing the Challenges of an Aging Population; Board on Health Care Services; Institute of Medicine. Delivering High-Quality Cancer Care: Charting a New Course for a System in Crisis. Delivering high-quality cancer care: Charting a new course for a system in crisis. Washington (DC): Nationel Academies Press; 2013.
Lai X, Li C, Yang Y, et al. Global estimates of rehabilitation needs and disease burden in tracheal, bronchus, and lung cancer from 1990 to 2019 and projections to 2045 based on the global burden of disease study 2019.Front Oncol. 2023;13:1152209.
Tas F, Ciftci R, Kilic L, Karabulut S. Age is a prognostic factor affecting survival in lung cancer patients. Oncol Lett. 2013;6(5):1507-1513.
Wang Y, Huang X, Luo G, et al. The aging lung: microenvironment, mechanisms, and diseases.Front Immunol. 2024;15:1383503.
Yang CJ, Brown AB, Deng JZ, et al. The oldest old: a national analysis of outcomes for patients 90 years or older with lung cancer.Ann Thorac Surg. 2020;109(2):350-357.
Choi WI, Choi J, Kim MA, Lee G, Jeong J, Lee CW. Higher age puts lung cancer patients at risk for not receiving anti-cancer treatment.Cancer Res Treat. 2019;51(3):1241-1248.
Dias LM, Bezerra MR, Barra WF, Rego F. Refusal of medical treatment by older adults with cancer: a systematic review. Ann Palliat Med. 2021;10(4):4868-4877.
Fernandes F, Turra CM, Rios Neto ELG. World population aging as a function of period demographic conditions.Demographic Research. 2023;48(13):353-372.
GBD 2019 Diseases and Injuries Collaborators. Global burden of 369 diseases and injuries in 204 countries and territories, 1990-2019: a systematic analysis for the Global Burden of Disease Study 2019.Lancet. 2020;396(10258):1204-1222. Erratum in: Lancet. 2020;396(10262):1562.
GBD 2019 Demographics Collaborators. Global age-sex-specific fertility, mortality, healthy life expectancy (HALE), and population estimates in 204 countries and territories, 1950-2019: a comprehensive demographic analysis for the Global Burden of Disease Study 2019.Lancet. 2020;396(10258):1160-1203.
Fantom N, Serajuddin U. The World Bank’s classification of countries by income: The World Bank; 2016.
Whitehead SJ, Ali S. Health outcomes in economic evaluation: the QALY and utilities.Br Med Bull. 2010;96(1):5-21.
Briggs AM, Jordan JE, Sharma S, et al. Context and priorities for health systems strengthening for pain and disability in low- and middle-income countries: a secondary qualitative study and content analysis of health policies.Health Policy Plan. 2023;38(2):129-149.
Torre LA, Siegel RL, Jemal A. Lung Cancer Statistics.Adv Exp Med Biol. 2016;893:1-19.
VanderWalde A, Pal SK, Reckamp KL. Management of non-small-cell lung cancer in the older adult.Maturitas. 2011;68(4):311-321.
Mirahmadizadeh A, Hassanzadeh J, Moradi AM, Gheibi Z, Heiran A. Projection of the prevalence of tracheal, bronchus, and lung cancer incidence using cigarette smoking prevalence in Iran from 1990 to 2018: a comparison of latent period-based models with standard forecasting models.BMC Public Health. 2024;24(1):1896.
Thun M, Peto R, Boreham J, Lopez AD. Stages of the cigarette epidemic on entering its second century.Tob Control. 2012;21(2):96-101.
National Center for Chronic Disease P, Health Promotion Office on S, Health. Reports of the Surgeon General. The Health Consequences of Smoking-50 Years of Progress: A Report of the Surgeon General. Atlanta (GA): Centers for Disease Control and Prevention (US); 2014.
Fouda S, Kelany M, Moustafa N, et al. Tobacco smoking in Egypt: a scoping literature review of its epidemiology and control measures.East Mediterr Health J. 2018;24(2):198-215.
Deng Y, Zhao P, Zhou L, et al. Epidemiological trends of tracheal, bronchus, and lung cancer at the global, regional, and national levels: a population-based study.J Hematol Oncol. 2020;13:98.
Scarselli A, Corfiati M, Di Marzio D, Marinaccio A, Iavicoli S. Gender differences in occupational exposure to carcinogens among Italian workers.BMC Public Health. 2018;18(1):413.
Khattab A, Javaid A, Iraqi G, et al. Smoking habits in the Middle East and North Africa: results of the BREATHE study.Respir Med. 2012;106(Suppl 2):16-24.
Schwartz AG, Ray RM, Cote ML, et al. Hormone use, reproductive history, and risk of lung cancer: The Women’s Health Initiative studies.J Thorac Oncol. 2015;10(7):1004-1013.
Crispo A, Brennan P, Jöckel KH, et al. The cumulative risk of lung cancer among current, ex- and never-smokers in European men.Br J Cancer. 2004;91(7):1280-1286.
Safiri S, Nejadghaderi SA, Karamzad N, et al. Global, regional and national burden of cancers attributable to high fasting plasma glucose in 204 countries and territories, 1990-2019.Front Endocrinol (Lausanne). 2022;13:879890.
Suh S, Kim KW. Diabetes and cancer: cancer should be screened in routine diabetes assessment.Diabetes Metab J. 2019;43(6):733-743.
Zhang Y, Mi M, Zhu N, et al. Global burden of tracheal, bronchus, and lung cancer attributable to occupational carcinogens in 204 countries and territories, from 1990 to 2019: results from the global burden of disease study 2019.Ann Med. 2023;55(1):2206672.
Bray F, Ferlay J, Soerjomataram I, Siegel RL, Torre LA, Jemal A. Global cancer statistics 2018: GLOBOCAN estimates of incidence and mortality worldwide for 36 cancers in 185 countries.CA Cancer J Clin. 2018;68(6):394-424. Erratum in: CA Cancer J Clin. 2020;70(4):313.
Wang Z, Hu L, Li J, Wei L, Zhang J, Zhou J. Magnitude, temporal trends and inequality in global burden of tracheal, bronchus and lung cancer: findings from the Global Burden of Disease Study 2017.BMJ Glob Health. 2020;5(10):e002788.
Yang D, Liu Y, Bai C, Wang X, Powell CA. Epidemiology of lung cancer and lung cancer screening programs in China and the United States.Cancer Lett. 2020;468:82-87.
Steenland K, Mannetje A, Boffetta P, et al. Pooled exposure-response analyses and risk assessment for lung cancer in 10 cohorts of silica-exposed workers: an IARC multicentre study.Cancer Causes Control. 2001;12(9):773-784. Erratum in: Cancer Causes Control. 2002;13(8):777.
Jazieh AR, Algwaiz G, Errihani H, et al. Lung Cancer in the Middle East and North Africa Region.J Thorac Oncol. 2019;14(11):1884-1891.
Nanavaty P, Alvarez MS, Alberts WM. Lung cancer screening: advantages, controversies, and applications.Cancer Control. 2014;21(1):9-14.
Khanmohammadi S, Saeedi Moghaddam S, Azadnajafabad S, et al. Burden of tracheal, bronchus, and lung cancer in North Africa and Middle East countries, 1990 to 2019: Results from the GBD study 2019.Front Oncol. 2022;12:1098218.